
In this recipe, you will learn how to leverage lookups to maintain a state table that will capture the first time a session was seen and continually update the existing session's information accordingly. You can use this to determine if a session has gone stale and has been abandoned or if someone is trying to hijack an old session.
To step through this recipe, you will need a running Splunk Enterprise server, with the sample data loaded from Chapter 1, Play Time – Getting Data In. You should be familiar with navigating the Splunk user interface.
Follow the steps in this recipe to create a state table of sessions:
- Log in to your Splunk server.
- Select the Operational Intelligence application.
- In the search bar, enter the following search and select to run it over Last 15 minutes:
index=main sourcetype="access_combined" | eval firsttime=_time | eval lasttime=_time | stats last(firsttime) as firsttime, first(lasttime) as lasttime by JSESSIONID | outputlookup createinapp=true session_state.csv
- You should see a tabulated list by session ID, listing the firsttime and lasttime columns. Splunk will also have created a lookup named
sessions.csvas a result of the search.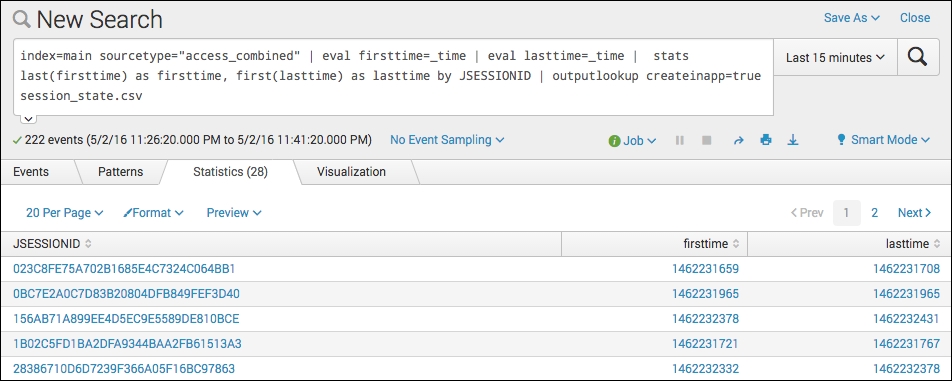
- Next, amend the query slightly as follows and rerun the search over Last 15 minutes again:
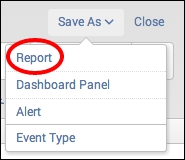
index=main sourcetype="access_combined" | eval firsttime=_time | eval lasttime=_time | fields JSESSIONID firsttime lasttime | inputlookup session_state.csv append=true | stats last(firsttime) as firsttime, first(lasttime) as lasttime by JSESSIONID | outputlookup createinapp=true session_state.csv - You should see a very similar (if not the same) list of times and session IDs. Now, let's save this search as a report. Click on the Save As link and select Report.
- Enter
cp07_session_stateas the title and then click on Save.
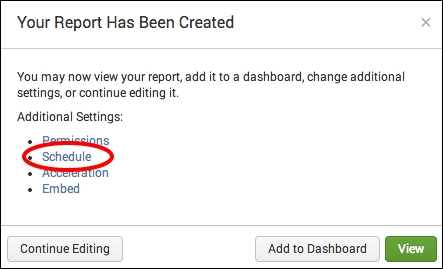
- Click on the Schedule link.
- Check the Schedule Report box.
- In the Schedule dropdown, select Run on Cron Schedule, and then enter
*/15 * * * *in the Cron Expression field. This cron schedule means that run every 15 minutes. Then, click on Next and then on Save.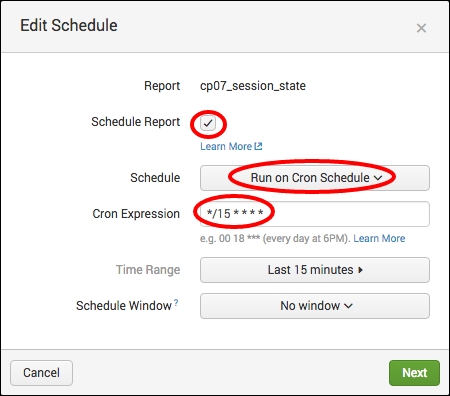
- The state table is now created and will periodically update every 15 minutes. Let's now view the table. Enter the following search in the search bar of the Operational Intelligence application:
|inputlookup session_state.csv
| eval firsttime_daysago=round((now()-firsttime)/60/60/24)
| eval lasttime_daysago=round((now()-lasttime)/60/60/24)
| convert ctime(firsttime), ctime(lasttime)
| table JSESSIONID firsttime, firsttime_daysago, lasttime, lasttime_daysago
- You should be presented with a session table, listing the first time the session was seen, how many days ago the first time was, the last time the session was seen, and how many days ago the last time was.
This recipe is designed to maintain some form of state about the sessions being used within the application we are monitoring. The data we are capturing includes both the first time the session ID was detected and the last time the session ID was detected. A lookup table is used to maintain the up-to-date states of the sessions over time and will be a lot faster to search than trying to search for all the sessions over time.
In this recipe, we initially started with two searches: the first search was used to create the lookup file as this did not exist, and the second search was the search that we chose to save and schedule. This second search brings in the existing lookup table we created in the first search, which is why the first search was performed.
As the first and second searches are similar, let's explain how the second search works with the help of the following table:
|
Search fragment |
Description |
|---|---|
|
|
This tells Splunk to find all the web server logs in the main index. |
|
|
Here, we use the |
|
|
Next, we declare that we only want to use the |
|
|
Next, we leverage the |
|
|
Here, we leverage the |
|
|
Finally, we write back to the |
As this search is scheduled to run every 15 minutes and look back over the past 15 minutes, it will build up a large table of session IDs in time. This can be very useful for tracking purposes.
Once the lookup was saved and scheduled, the final part of the recipe involved putting together a search that leveraged inputlookup to view the data in the lookup file. You evaluated new fields to calculate the number of seconds between the present time (using now()) and both the firsttime and lasttime fields' epoch values. The convert command and the ctime function were then leveraged to display the firsttime and lasttime fields in a readable timestamp format rather than the epoch seconds.
The state table approach described previously works well for many use cases, but a more scalable approach might be needed for larger state tables. The state table in the recipe is completely rewritten each time the search runs. Rather than doing this, we can leverage the Splunk KV store to maintain the session table and modify the table only when there are new records or when the existing records need to be updated. This approach is described next.
We can actually convert the state table we just created into a KV store table and then modify the existing scheduled search accordingly.
Follow the next steps to convert the existing state table to leverage the Splunk KV store instead:
- Firstly, there is one small configuration step that we cannot do from the GUI. Create a new file called
collections.conf. Into this file, enter the name of the KV collection as follows:[session_state]
- Save this file to the following location and restart Splunk:
$SPLUNK_HOME/etc/apps/operational_intelligence/local
- Everything else can now be done from the GUI! We need to create the new KV lookup. Click on the Settings menu and then select the Lookups menu item. Then select Lookup Definitions to go to the Lookup Definitions screen.
- Select New to create a new lookup definition. Give the definition Name of
session_state, select Type of File-Based, and select thesession_state.csvin the Lookup file field. Then click Save.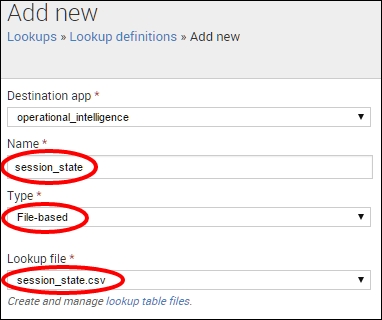
- Now we need to convert this to a KV lookup. Click on the session_state lookup definition you just created to go back into the editing screen. Change Type to KV Store. As soon as you do this, you will see that Splunk has already filled in the Supported fields with the field names from the file lookup – pretty nice! Give the lookup Collection Name of
session_state. This collection name must match the name of the collection you previously entered intocollections.confin the first step. Lastly, KV Store lookups in Splunk come with a hidden field called_key, which is a unique identifier of each row in the lookup. We are going to use this field to identify which rows we want to update in the future runs of our state table search. We need to add this as one of the Supported fields. Once this is done, click Save.
- Now we need to amend the search we created in the main recipe to leverage the new KV store instead of the CSV file. Click on the Reports menu item from within the Operational Intelligence application, and next to the
cp07_session_statereport line item, select Open in Search. Modify the search as follows:index=main sourcetype="access_combined" | eval firsttime=_time | eval lasttime=_time | fields JSESSIONID firsttime lasttime | stats last(firsttime) as firsttime, first(lasttime) as lasttime by JSESSIONID | lookup session_state JSESSIONID OUTPUTNEW _key as _key| outputlookup session_state append=t
- The search should run and present the familiar session state table. However, we have modified the search here to look up the new KV store lookup and return the hidden
_keyfield if there is a matchingJSESSIONIDalready in the KV store. Then we do anoutputlookupto thesession_stateKV store using theappend=tparameter. This will essentially update any existing records with a matching_keyfield. Any new records that do not have an existing entry in the KV store table will be appended to the KV table and assigned a unique_keyfield. - Once the newly modified search has run correctly, click Save to update the existing
cp07_session_statesearch with the new syntax. Congratulations! You are now using Splunk's KV store to maintain a session state table.