
When a basic search is executed in Splunk from the search bar, the search results are displayed in a raw event format by default. To many users, this raw event information is not particularly readable, and valuable information is often clouded by other less valuable data within the event. Additionally, if the events span several lines, only a few events can be seen on the screen at any one time.
In this recipe, we will write a Splunk search to demonstrate how we can leverage Splunk commands to make raw event data readable, tabulating events and displaying only the fields we are interested in.
To step through this recipe, you will need a running Splunk Enterprise server, with the sample data loaded from Chapter 1, Play Time – Getting Data In. You should be familiar with the Splunk search bar and search results area.
Follow the given steps to search and tabulate the selected event data:
- Log in to your Splunk server.
- Select the Search & Reporting application from the drop-down menu located in the top left-hand side of the screen.

- Set the time range picker to Last 24 hours and type the following search into the Splunk search bar:
index=main sourcetype=access_combined
Then, click on Search or hit Enter.
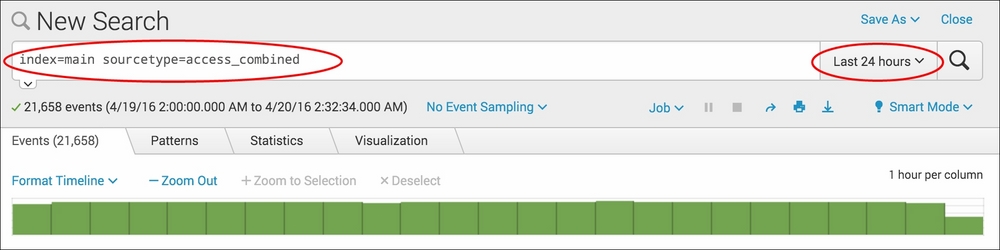
- Splunk will return the results of the search and display the raw search events under the search bar.
- Let's rerun the search, but this time we will add the
tablecommand as follows:index=main sourcetype=access_combined | table _time, referer_domain, method, uri_path, status, JSESSIONID, useragent
- Splunk will now return the same number of events, but instead of presenting the raw events to you, the data will be in a nicely formatted table, displaying only the fields we specified. This is much easier to read!

- Save this search by clicking on Save As and then on Report. Give the report the name
cp02_tabulated_webaccess_logsand click on Save. On the next screen, click on Continue Editing to return to the search.
Let's break down the search piece by piece:
|
Search fragment |
Description |
|---|---|
|
|
All the data in Splunk is held in one or more indexes. While not strictly necessary, it is a good practice to specify the index ( |
|
|
This tells Splunk to search only the data associated with the |
|
|
Using the |
In this recipe, you used the table command. The table command can have a noticeable performance impact on large searches. It should be used towards the end of a search, once all the other processing on the data by the other Splunk commands has been performed.
The table command is very useful in situations where we wish to present data in a readable format. Additionally, tabulated data in Splunk can be downloaded as a CSV file, which many users find useful for offline processing in spreadsheet software or for sending to others. There are some other ways we can leverage the table command to make our raw event data readable.
Often, there are situations where we want to present every event within the data in a tabular format, without having to specify each field one by one. To do this, we simply use a wildcard (*) character as follows:
index=main sourcetype=access_combined | table *
While tabulating every field using the wildcard (*) character is useful, you will notice that there are a number of Splunk internal fields, such as _raw, that appear in the table. We can use the fields command before the table command to remove the fields as follows:
index=main sourcetype=access_combined | fields - sourcetype, index, _raw, source date* linecount punct host time* eventtype | table *
If we do not include the minus (-) character after the fields command, Splunk will keep the specified fields and remove all the other fields.