
Before this chapter gets into everything that is great about visualizations, it is best to first cover the process of creating a dashboard. In this recipe, you will create a dashboard from scratch using the Splunk Web UI that we will then use for other recipes in this chapter.
To step through this recipe, you will need a running Splunk Enterprise server, with the sample data loaded from Chapter 1, Play Time – Getting Data In, and all the completed recipes from Chapter 2, Diving into Data – Search and Report. You should be familiar with navigating the Splunk user interface.
Follow the given steps to create an Operational Intelligence dashboard:
- Log in to your Splunk server.
- Select the default Search & Reporting application.
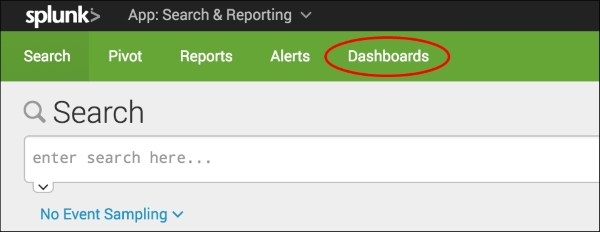
- From the menu bar, click on the Dashboards link:
- On the Dashboards screen, click on the Create New Dashboard button:

- The Create New Dashboard screen will pop up. Enter
Website Monitoringin the Title field. The ID field will be automatically populated; leave it as it is. The Description field can be left blank for now, but ensure that the Shared in App permission is selected. Finally, click on Create Dashboard: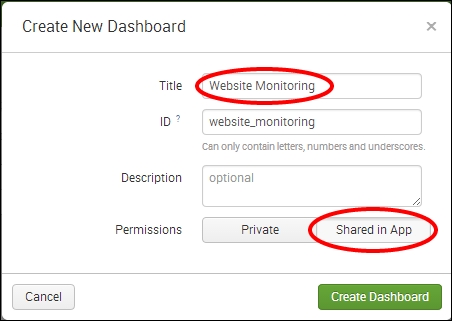
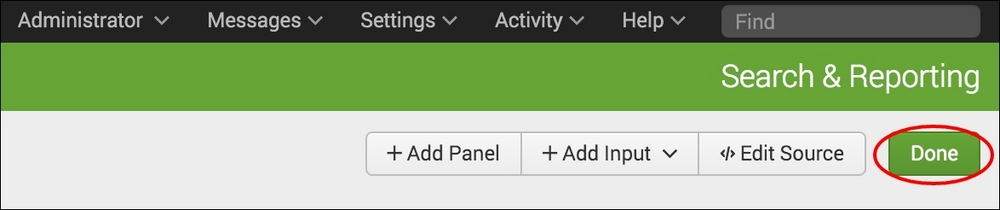
- The newly created Website Monitoring dashboard will appear in edit mode. We will add panels to the dashboard in the next few recipes. For now, just click on the Done button:
You have now created a blank dashboard ready to be populated with reports and visualizations.
When creating a dashboard through the user interface, Splunk builds the underlying dashboard object code in simple XML for you behind the scenes. Following this, the dashboard object will then be used as a container for the reports you add to it. You can always view the source code of the dashboard by clicking on the Edit button and then, from the drop-down menu, you can click on Edit Source. The simple XML source code for the dashboard will be displayed in the editor. Dashboards and simple XML will be covered in more detail in the next chapter.
Tip
There are several ways in which dashboards can be created in the Splunk user interface. In this recipe, we essentially created an empty dashboard which is ready to be filled with visualized reports. Splunk also allows dashboards to be created at the time of adding reports, as you will see later in this chapter.
When creating a dashboard, the default permission is for it to be private (only accessible by the user who created it). You might wish to share this or other dashboards with other users or groups who have an interest in these reports.
To change the permissions on a dashboard, you must first return to the Dashboards screen. This can be accomplished by clicking on the Dashboards menu, as outlined in step 3 of this recipe. Within the Dashboards screen, you will see the Website Monitoring dashboard that you created during the course of this recipe. Under the Actions column, you will see a clickable link labeled Edit; click on this link. A drop-down panel will appear; click on the item labeled Edit Permissions. The resulting pop-up window that appears will allow you to define permissions on a role-by-role basis and limit these permissions to be restrictive within the working application, or globally for all applications.
Tip
When creating dashboards through the GUI in Splunk, the default permission level should be private. However, in this recipe, you selected the Shared in App permissions button when creating the dashboard. This ensures that the new dashboard is automatically shared with everyone who has permissions to the application and saves you from having to edit permissions after creating it. On the backend, dashboards with application permissions are stored in the respective application directory structure. Dashboards with private permissions are stored in the respective user directory.