In the past two recipes of this chapter, you leveraged a method of data summarization called summary indexing to summarize data in a new index, which you then reported on. In this recipe, you will use another method of data summarization known as report acceleration to speed up your report times.
In this recipe, you will create a report to look for the maximum number of concurrent sessions over a time period of 30 days. This report will then be accelerated to speed up the time taken to execute the search.
To step through this recipe, you will need a running Splunk Enterprise server, with the sample data loaded from Chapter 1, Play Time – Getting Data In. You should be familiar with navigating the Splunk user interface and using the Splunk search language.
Follow the steps in this recipe to leverage report acceleration to display the maximum number of concurrent sessions over time:
- Log in to your Splunk server.
- Select the Operational Intelligence application.
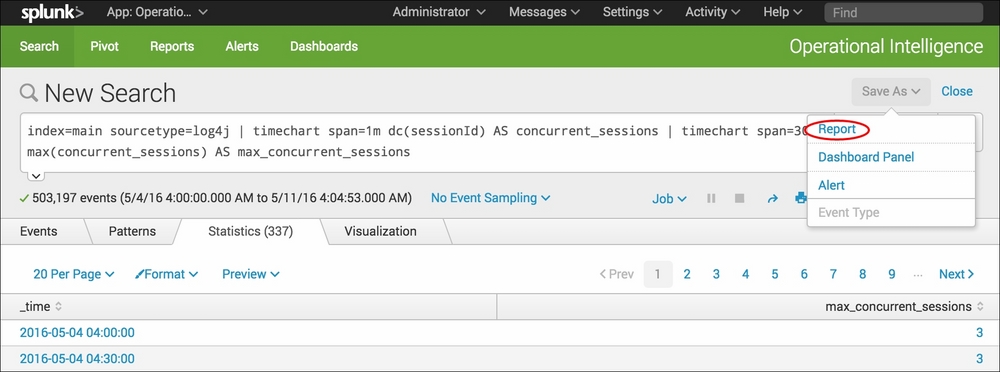
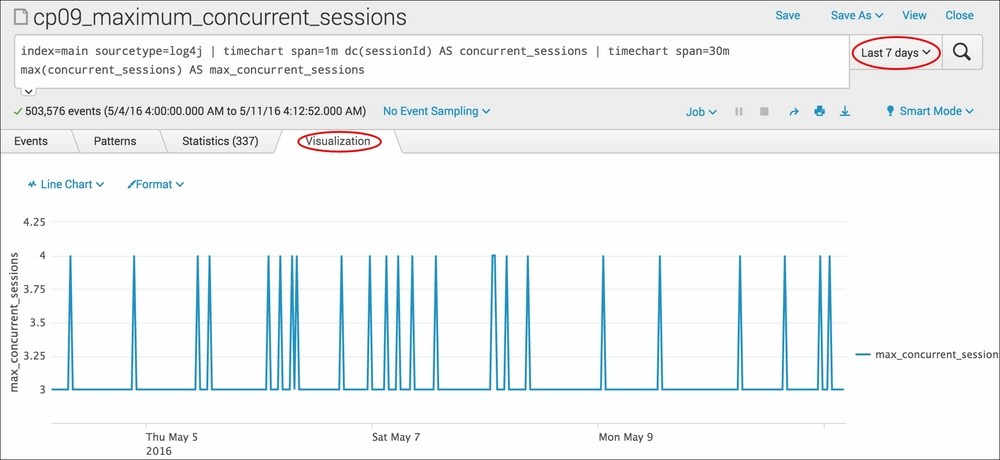
- From the search bar, enter the following search and select to run over Last 7 days:
index=main sourcetype=log4j | timechart span=1m dc(sessionId) AS concurrent_sessions | timechart span=30m max(concurrent_sessions) AS max_concurrent_sessions
- You might find that the search takes about 2-3 minutes to run if you have 7 days of generated data.
- Click on the Save As dropdown and select Report from the list:
- In the pop-up box that gets displayed, enter
cp09_maximum_concurrent_sessionsas the title of the report and select No in the Time Range Picker field. Then, click on Save: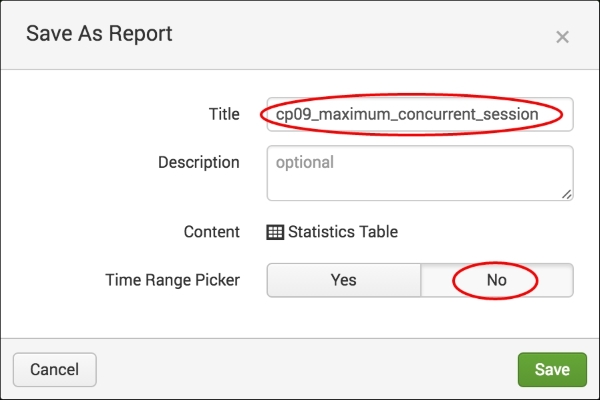
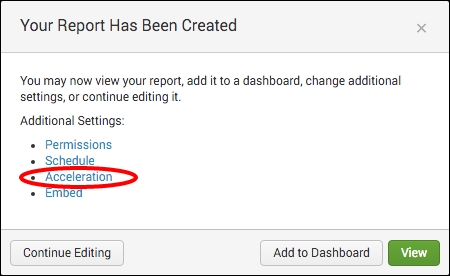
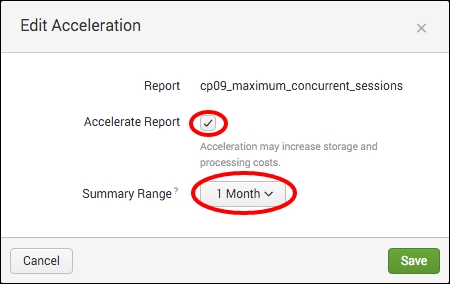
- On the next screen, select Acceleration from the list of additional settings:
- Select the Accelerate Report checkbox, set a summary range of 1 Month, and then click on Save. If you see a warning about running in verbose mode, it is okay to ignore:
- The report is now saved and Splunk builds the accelerated summary behind the scenes. There is no need to schedule the search. To check the status of the summary building, click on the Settings menu and select Report acceleration summaries:

- The list of report acceleration summaries will be displayed, and you will see the report that you just created with Summary Status of Building Summary:

- If you do not see the summary building, try hitting refresh on the browser. Sometimes, you have to wait a bit. If you are impatient, click on the Summary ID value that you are monitoring and you will be taken to a screen where you can force a build by clicking on Rebuild. If you see a status of Pending, it is normal as it is telling you that an update to the summary is pending. If you see Not enough data to summarize, it is letting you know that there is not enough data yet to summarize properly and it will wait until there is. If that occurs, consider updating the Summary Range in the acceleration configuration to a smaller window:

- Eventually, the report will complete the building of the summary. When it is complete, click on the Apps menu and select the Operational Intelligence app.
- Once back in the app, click on Reports, filter on the word
maximum, and click on Open in Search next to thecp09_maximum_concurrent_sessionsreport: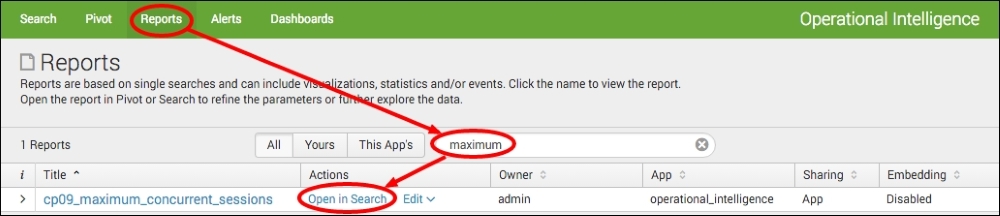
- The report will now load in seconds. Select the Visualization tab to see the data presented as a line chart representing the maximum number of concurrent sessions, and select a time range of Last 7 days:
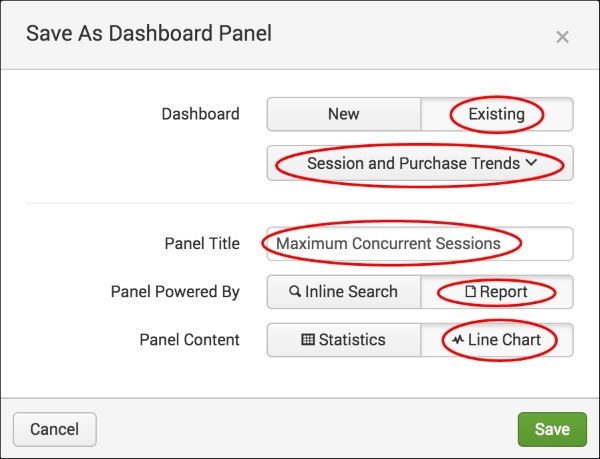
- Let's save this chart to our Session and Purchase Trends dashboard that we created in the first recipe. Click on the Save As dropdown and select Dashboard Panel.
- In the pop-up box that appears, select Existing in the Dashboard field, and then select the Session and Purchase Trends dashboard. Enter Maximum Concurrent Sessions as the title of the panel, ensure that the panel is set to be powered by Report, ensure that the Panel Content is set to Line Chart, and click on Save to save the chart to the dashboard:
In this recipe, you first created a search to look for concurrent sessions over time. The search has two timechart components to it. Let's break down the search piece by piece:
|
Search fragment |
Description |
|---|---|
index=main sourcetype=log4j |
Select to search the application data in the main index. |
| timechart span=1m dc(sessionId) AS concurrent_sessions |
The first |
| timechart span=30m max(concurrent_sessions) AS max_concurrent_sessions |
The second |
This search is actually fairly resource intensive when searched for over an extended period of time. Running the non-accelerated search over 7 days will likely take several minutes, mostly because Splunk performs a calculation for every minute of data for the past week. Once the report is created, you select to accelerate it over a 1-month period. Behind the scenes, Splunk creates an internal summary in line with the data itself. Once the summary is built, you return to the report and rerun it; it completes in seconds, thanks to the new acceleration. As the report is accelerated for an entire month, you can look back up to a month in the past and it will still run fast. Going forward, Splunk will periodically refresh the internal summary every 10 minutes to summarize and accelerate any new event data.
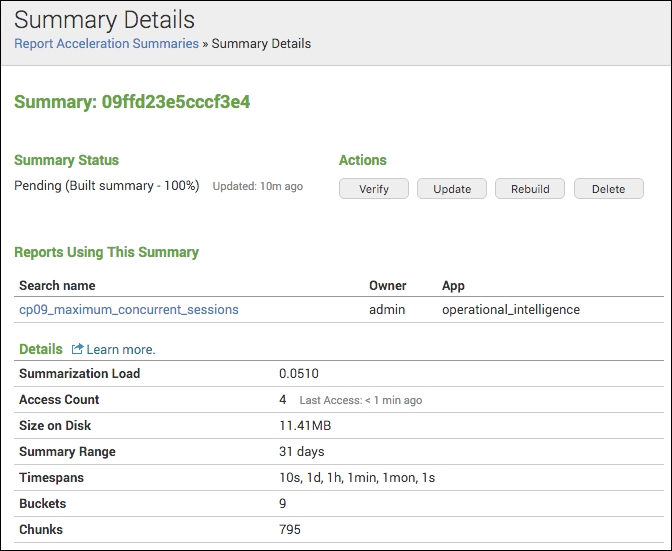
Report acceleration does add some overhead as disk space is used to store the internal summary data. Splunk provides detailed information on the health of the various reports that are accelerated.
To investigate the details of an accelerated report, first click on the Settings menu and then select Report Acceleration Summaries. A list of all accelerated reports will load, together with a high-level build status. Click on the report accelerated in this recipe to drill into the details. The Summary Details screen provides some good insights into the accelerated report, including information on how many times the report has been accessed, the range the report is set at, and how much data is being used by the summary: