In this chapter, we will cover the basic ways to search data in Splunk. We will cover the following recipes:
- Making raw event data readable
- Finding the most accessed web pages
- Finding the most used web browsers
- Identifying the top-referring websites
- Charting web page response codes
- Displaying web page response time statistics
- Listing the top-viewed products
- Charting the application's functional performance
- Charting the application's memory usage
- Counting the total number of database connections
In the previous chapter, we learned about the various ways to get data into Splunk. In this chapter, we will dive right into the data and get our hands dirty.
The ability to search machine data is one of Splunk's core functions, and it should come as no surprise that many other features and functions of Splunk are heavily driven-off searches. Everything from basic reports and dashboards to data models and fully featured Splunk applications are powered by Splunk searches behind the scenes.
Splunk has its own search language known as the Search Processing Language (SPL). This SPL contains hundreds of search commands, most of which also have several functions, arguments, and clauses. While a basic understanding of SPL is required in order to effectively search your data in Splunk, you are not expected to know all the commands! Even the most seasoned ninjas do not know all the commands and regularly refer to the Splunk manuals, website, or Splunk Answers (http://answers.splunk.com).
Tip
To get you on your way with SPL, be sure to check out the search command cheat sheet and download the handy quick reference guide available at http://docs.splunk.com/Documentation/Splunk/latest/SearchReference/SplunkEnterpriseQuickReferenceGuide.
Searching
Searches in Splunk usually start with a base search, followed by a number of commands that are delimited by one or more pipe (|) characters. The result of a command or search to the left of the pipe is used as the input for the next command to the right of the pipe. Multiple pipes are often found in a Splunk search to continually refine data results as needed. As we go through this chapter, this concept will become very familiar to you.

Splunk allows you to search for anything that might be found in your log data. For example, the most basic search in Splunk might be a search for a keyword such as error or an IP address such as 10.10.12.150. However, searching for a single word or IP over the terabytes of data that might potentially be in Splunk is not very efficient. Therefore, we can use the SPL and a number of Splunk commands to really refine our searches. The more refined and granular the search, the faster the time to run and the quicker you get to the data you are looking for!
Tip
When searching in Splunk, try to filter as much as possible before the first pipe (|) character, as this will save CPU and disk I/O. Also, pick your time range wisely. Often, it helps to run the search over a small time range when testing it and then extend the range once the search provides what you need.
Boolean operators
There are three different types of Boolean operators available in Splunk. These are AND, OR, and NOT. Case sensitivity is important here, and these operators must be in uppercase to be recognized by Splunk. The AND operator is implied by default and is not needed, but does no harm if used.
For example, searching for the term error or success would return all the events that contain either the word error or the word success. Searching for error success would return all the events that contain the words error and success. Another way to write this can be error AND success. Searching web access logs for error OR success NOT mozilla would return all the events that contain either the word error or success, but not those events that also contain the word mozilla.
Common commands
There are many commands in Splunk that you will likely use on a daily basis when searching data within Splunk. These common commands are outlined in the following table:
Time modifiers
The drop-down time range picker in the Graphical User Interface (GUI) to the right of the Splunk search bar allows users to select from a number of different preset and custom time ranges. However, in addition to using the GUI, you can also specify time ranges directly in your search string using the earliest and latest time modifiers. When a time modifier is used in this way, it automatically overrides any time range that might be set in the GUI time range picker.
The earliest and latest time modifiers can accept a number of different time units: seconds (s), minutes (m), hours (h), days (d), weeks (w), months (mon), quarters (q), and years (y). Time modifiers can also make use of the @ symbol to round down and snap to a specified time.
For example, searching for sourcetype=access_combined earliest=-1d@d latest=-1h will search all the access_combined events from midnight a day ago until an hour ago from now. Note that the snap (@) will round down such that if it were 12 p.m. now, we would be searching from midnight a day and a half ago until 11 a.m. today.
Working with fields
Fields in Splunk can be thought of as keywords that have one or more values. These fields are fully searchable by Splunk. At a minimum, every data source that comes into Splunk will have the source, host, index, and sourcetype fields, but some source might have hundreds of additional fields. If the raw log data contains key-value pairs or is in a structured format such as JSON or XML, then Splunk will automatically extract the fields and make them searchable. Splunk can also be told how to extract fields from the raw log data in the backend props.conf and transforms.conf configuration files.
Searching for specific field values is simple. For example, sourcetype=access_combined status!=200 will search for events with a sourcetype field value of access_combined that has a status field with a value other than 200.
Note
Splunk has a number of built-in pre-trained sourcetypes that ship with Splunk Enterprise that might work with out-of-the-box, common data sources. These are available at http://docs.splunk.com/Documentation/Splunk/latest/Data/Listofpretrainedsourcetypes.
In addition, Technical Add-Ons (TAs), which contain event types and field extractions for many other common data sources such as Windows events, are available from the Splunk app store at https://splunkbase.splunk.com.
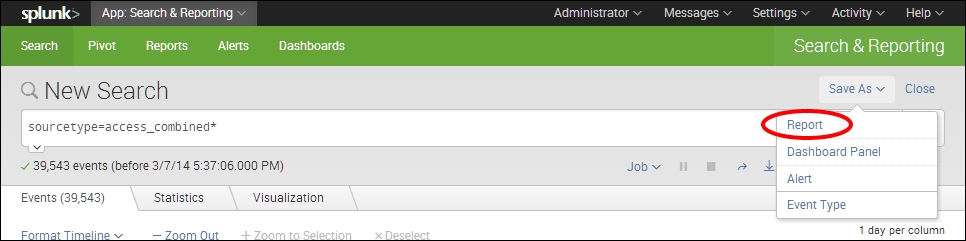
Saving searches
Once you have written a nice search in Splunk, you may wish to save the search so that you can use it again at a later date or use it for a dashboard. Saved searches in Splunk are known as Reports. To save a search in Splunk, you simply click on the Save As button on the top right-hand side of the main search bar and select Report.