
As we saw in the Adding a force-directed graph of web hits recipe, using the D3 visualizations that come included in the Splunk Web Framework Toolkit app allows for more creative and unique representations of our data.
This recipe will show you how to create a new dashboard containing a calendar heatmap of product purchases for the past week and place it in the Operational Intelligence application.
To step through this recipe, you will need a running Splunk Enterprise server, with the sample data loaded from Chapter 1, Play Time – Getting Data In. You should be familiar with navigating the Splunk user interface and using the Splunk search language. You must also have completed the Adding a force-directed graph of web hits recipe in this chapter, as the Web Framework Toolkit app will be leveraged for this recipe. Some basic knowledge of JavaScript is recommended.
Follow the steps in this recipe to create a new dashboard that contains a calendar heatmap of purchases:
- Log in to your Splunk server.
- Select the Operational Intelligence application:

- Click on the Administration menu and then click on the Dashboards menu item.
- Click on the Create New Dashboard button.
- In the Create New Dashboard window, enter
Purchase Volumesin the Title field and select Shared in App in the Permissions field. - Click on Create Dashboard:

- Click on Done:

- Click on the Edit button and select the Convert to HTML menu item:

- Select the Replace Current option and click on Convert Dashboard:

- Click on the Edit HTML button:

- In the dashboard editor form, locate the HTML
<div>tag with thedata-role="main"value and update it to look like the following lines of code:<div class="dashboard-body container-fluid main-section-body" data-role="main"> <div class="dashboard-header clearfix"> <h2>Purchases</h2> </div> <div class="dashboard-row dashboard-row1"> <div class="dashboard-cell" style="width: 100%;"> <div class="dashboard-panel clearfix"> <div class="panel-element-row"> <div class="dashboard-element chart" id="element1" style="width: 100%"> <div class="panel-head"> <h3>Volumes</h3> </div> <div class="panel-body"> <div id="cal-chart"></div> </div> </div> </div> </div> </div> </div> </div> - Locate the
require.configstatement and add the additional path that will help Splunk find the toolkit components. Add the app path as follows (remember to add a comma to the preceding item after0):require.config({ baseUrl: "{{SPLUNKWEB_URL_PREFIX}}/static/js", waitSeconds: 0, // Disable require.js load timeout paths: { "app": "../app" } }); - Locate the
requireportion of the JavaScript and add this item to the array (remember to add a comma to the preceding array item):"app/splunk_wftoolkit/ /components/calendarheatmap/calendarheatmap" - Below the
functionstatement, addCalendarHeatmap(remember to add a comma to the preceding array item):PostProcessManager, UrlTokenModel, CalendarHeatmap
- Locate the
SEARCH MANAGERSsection of the JavaScript and add the following code:var search1 = new SearchManager({ "id": "search1", "status_buckets": 0, "latest_time": "now", "search": " index=main sourcetype=log4j requestType=checkout | timechart span=1h sum(total) as "Total Purchases($)"", "cancelOnUnload": true, "earliest_time": "-7d", "app": utils.getCurrentApp(), "auto_cancel": 0, "preview": true }, {tokens: true, tokenNamespace: "submitted"}); - Locate the
VIEWS: VISUALIZATION ELEMENTSsection of the JavaScript and add the following lines of code:var calendarheatmap = new CalendarHeatmap({ 'id' : 'fcal', 'managerid' : 'search1', 'domain' : 'day', 'subDomain' : 'x_hour', 'el' : $('#cal-chart') }).render(); - Click on Save, and you will be taken back to the dashboard.
- You should see a dashboard rendering the number of product purchases each hour for the past 7 days as a calendar heatmap visualization. The scroll arrows allow you to scroll to different days in the calendar:
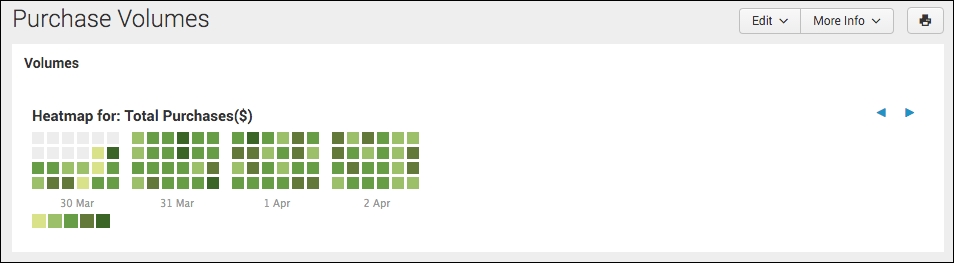
The calendar heatmap visualization is a way to represent and render the magnitude of time-series data as a heatmap. In this case, we represented the number of purchases per hour for each given day over the past 7 days. From this data, we can use it to visually spot trends or patterns in purchasing either in the time of the day, day of the week, or week of the year.
As we saw in the earlier force-directed graph recipe, the calendar heatmap is a prebuilt component that is available when you install the Splunk Web Framework Toolkit app.
The dashboard needs to be in HTML format, so you created an empty dashboard in SimpleXML and then converted it. You then added the HTML code that will hold the heatmap visualization and set the correct CSS classes to ensure that it is formatted with the right look and feel to match the Operational Intelligence app.
The majority of the dashboard functionality comes in the JavaScript section. You first added references to the libraries you copied into the Operational Intelligence app from the Web Framework Toolkit app so that the Operational Intelligence app can see them. Next, you added a search manager object that controls the searching functionality and returns the data to the heatmap object. Finally, you added an object that will hold your heatmap and tell it which HTML entity it will be put into.
Note
To learn more about D3.js and the types of visualizations that you can create with it, visit http://d3js.org/.