
Log data often contains seemingly cryptic codes that have all sorts of meanings. This is true of our web access logs, where there is a status code that represents a web page response. This code is very useful as it can tell us whether certain events were successful or not. For example, error codes found in purchase events are less than ideal, and if our website was at fault, then we might have lost a sale.
In this recipe, we will write a Splunk search to chart web page responses against the various web pages on the site.
To step through this recipe, you will need a running Splunk Enterprise server, with the sample data loaded from Chapter 1, Play Time – Getting Data In. You should be familiar with the Splunk search bar and the time range picker.
Follow the given steps to chart the web page response codes over time:
- Log in to your Splunk server.
- Select the Search & Reporting application.
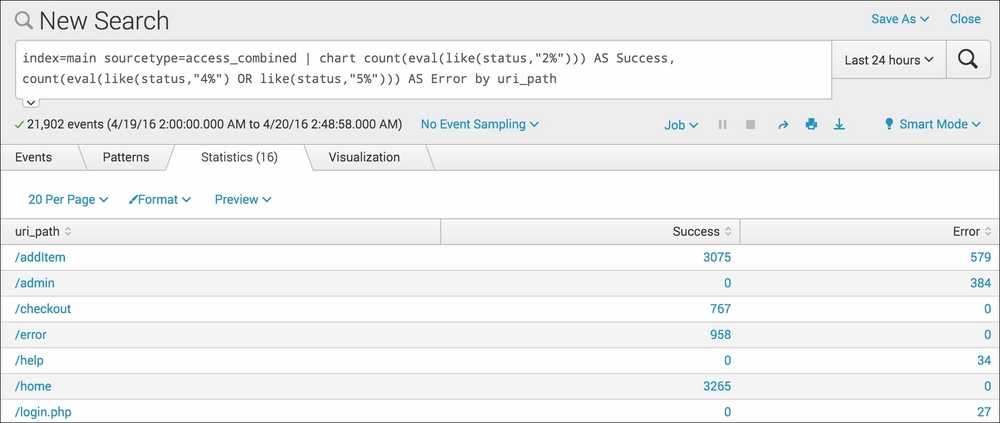
- Ensure that the time range picker is set to Last 24 hours and type the following search into the Splunk search bar. Then, click on Search or hit Enter.
index=main sourcetype=access_combined | chart count(eval(like(status,"2%"))) AS Success, count(eval(like(status,"4%") OR like(status,"5%"))) AS Error by uri_path
- Splunk will return a tabulated list of web pages, detailing for each page how many events were successful and how many generated errors.
- Click on the Visualization tab, and you will see this data represented in a column (by default) chart.
- Save this search by clicking on Save As and then on Report. Give the report the name
cp02_webpage_response_codesand click on Save. On the next screen, click on Continue Editing to return to the search.
In this recipe, we selected to search by the uri_path field. This field represents the various web pages on the site. Let's break down the search piece by piece:
|
Search fragment |
Description |
|---|---|
|
|
You should now be familiar with this search from the earlier recipes in this chapter. |
|
|
Stripping away the complexity for a moment, this is very similar to performing stats count by As the status field is essentially just a code, we are evaluating whether the code represents success or error. We do this using an inline |
Hopefully, you can start to see the power of the SPL, as we start to ramp up the complexity a bit. We can now take this search a little further to provide a bit more insight.
We can further amend the search to show only the addItem and
checkout web pages events, which seems a little more relevant to sales intelligence. Additionally, using the addcoltotals command, we can add up the total success and error events:
index=main sourcetype=access_combined uri_path="/addItem" OR uri_path="/checkout" | chart count(eval(like(status,"2%"))) AS Success, count(eval(like(status,"4%") OR like(status,"5%"))) AS Error by uri_path | addcoltotals label=Total labelfield=uri_path
When this updated search is run, you should see results similar to the following screenshot:

We use labelfield=uri_path and label=Total to tell Splunk to place a value of Total in the uri_path field column.