
Another of the data samples we loaded in Chapter 1, Play Time – Getting Data In, contained application logs from our application server. These have a Splunk sourcetype of log4j and detail the various calls that our application makes to the backend database in response to user web requests, in addition to providing insight into memory utilization and other health-related information. We are particularly interested in tracking how our application is performing in relation to the time taken to process user-driven requests for information.
In this recipe, we will write a Splunk search to find out how our application is performing. To do this, we will analyze database call transactions and chart the maximum, mean, and minimum transaction durations over the past week.
To step through this recipe, you will need a running Splunk Enterprise server, with the sample data loaded from Chapter 1, Play Time – Getting Data In. You should be familiar with the Splunk search bar and the time range picker.
Follow the given steps to chart the application's functional performance over the past week:
- Log in to your Splunk server.
- Select the Search & Reporting application.
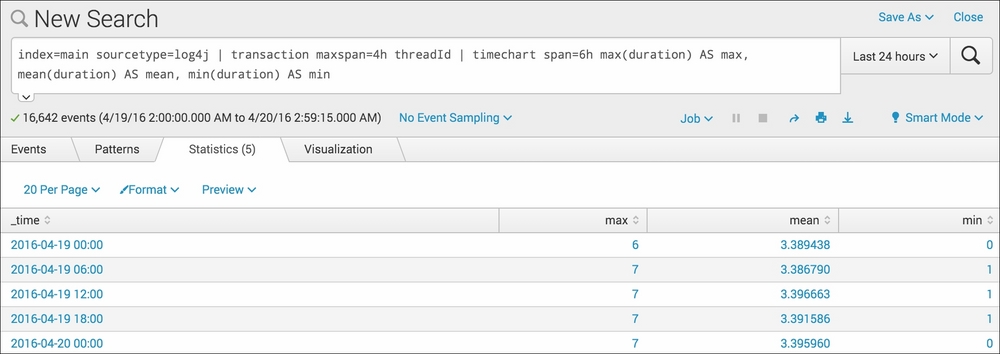
- Ensure that the time range picker is set to Last 24 hours and type the following search into the Splunk search bar. Then, click on Search or hit Enter.
index=main sourcetype=log4j | transaction maxspan=4h threadId | timechart span=6h max(duration) AS max, mean(duration) AS mean, min(duration) AS min
- Splunk will return a tabulated list, detailing the maximum, mean, and minimum database transaction durations for every 6-hour period, going back the last 24 hours.
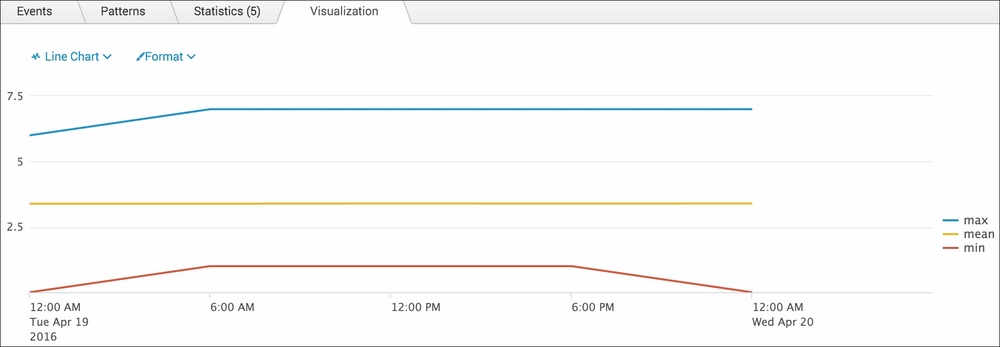
- This is great, but hard to visualize in a tabular form. Click on the Visualization tab and you will see this data represented as a chart.
- Click on the chart type link in the upper-left of the chart (next to the Format link) and select Line if not already selected. Splunk now presents this data in a nice line chart, and we can now see the maximum, mean, and minimum levels much more clearly.
- Save this search by clicking on Save As and then on Report. Give the report the name
cp02_application_performanceand click on Save. On the next screen, click on Continue Editing to return to the search.
Let's break down the search piece by piece:
|
Search fragment |
Description |
|---|---|
|
index=main sourcetype=log4j |
In this example, we search for our application logs which have the |
|
| transaction maxspan=4h threadId |
Using the |
|
|
Using the |