
As we saw in the previous chapter, dashboards are a great way to present many different pieces of information. Rather than having lots of disparate dashboards across your Splunk environment, it makes a lot of sense to group related dashboards into a common Splunk application, for example, putting operational intelligence dashboards into a common Operational Intelligence application.
In this recipe, you will learn how to move the dashboards and the associated reports you created in the last couple of chapters into our new Operational Intelligence application.
To step through this recipe, you will need a running Splunk Enterprise server, with the sample data loaded from Chapter 1, Play Time – Getting Data In. You should have also completed the recipes from the earlier chapters. You should be familiar with navigating the Splunk user interface.
Follow these steps to move your dashboards into the new application:
- Log in to your Splunk server.
- Select the newly created Operational Intelligence application.
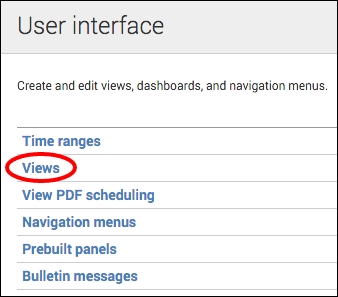
- From the top menu, select Settings and then select the User interface menu item.

- Click on the Views section.
- In the App Context drop-down, select Searching & Reporting (search) or whatever application you were in when creating the dashboards in the previous chapter.

- Locate the
website_monitoringdashboard row in the list of views and click on the Move link to the right of the row. - In the Move Object popup, select the Operational Intelligence (operational_intelligence) application that was created earlier and then click on the Move button.

- A message bar will then be displayed at the top of the screen to confirm that the dashboard was moved successfully.
- Repeat from step 5 to move the product_monitoring dashboard as well.

- After the Website Monitoring and Product Monitoring dashboards have been moved, we next want to move all the reports we created in the previous recipes, as these power the dashboards and provide operational intelligence insight. From the top menu, select Settings, but this time, select Searches, Reports, and Alerts.
- Select the Search & Reporting (search) context and filter by
cp0*to view the searches (reports) created in Chapter 2, Diving into Data – Search and Report and Chapter 3, Dashboards and Visualizations – Make Data Shine. Click on the Move link of the firstcp0*search in the list.
- Select to move the object to the Operational Intelligence (operational_intelligence) application and click on the Move button.
- A message bar will then be displayed at the top of the screen to confirm that the dashboard was moved successfully.
- Select the Search & Reporting (search) context and repeat from step 11 to move all the other searches over to the new Operational Intelligence application—this seems like a lot but will not take you long!
All the dashboards and reports are now moved to your new Operational Intelligence application.
In the previous recipe, we revealed how the Splunk apps are essentially just collections of directories and files. Dashboards are XML files found within the $SPLUNK_HOME/etc/apps directory structure. When moving a dashboard from one app to another, Splunk essentially just moves the underlying file from a directory inside one app to a directory in the other app. In this recipe, you moved the dashboards from the Search & Reporting app to the Operational Intelligence app, as represented in the following screenshot:

As visualizations on the dashboards leverage the underlying saved searches (or reports), you also moved these reports to the new app so that the dashboards maintain permission to access them. Rather than moving the saved searches, we could have changed the permissions of each search to Global so that they could be seen from all the other apps in Splunk. However, the other reason we moved the reports was to keep everything contained within a single Operational Intelligence application, which we will continue to build out going forward.
Tip
It is best practice to avoid setting permissions to Global for reports and dashboards, as this makes them available to all the other applications when they most likely do not need to be. Additionally, setting global permissions can make things a little messy from a housekeeping perspective and crowd the lists of reports and views that belong to specific applications. The exception to this rule might be for knowledge objects such as tags, event types, macros, and lookups, which often have advantages in being available across all applications.
As you went through this recipe, you probably noticed that the dashboards had application-level permissions but the reports had private-level permissions. The reports are private as this is the default setting in Splunk when they are created. This private-level permission restricts access to your user account and admin users. In order to make the reports available to the other users of your application, you need to change the permissions of the reports to Shared in App, as we did when adjusting the permissions of reports.
Changing the sharing permission levels of your reports from the default Private to App is relatively straightforward:
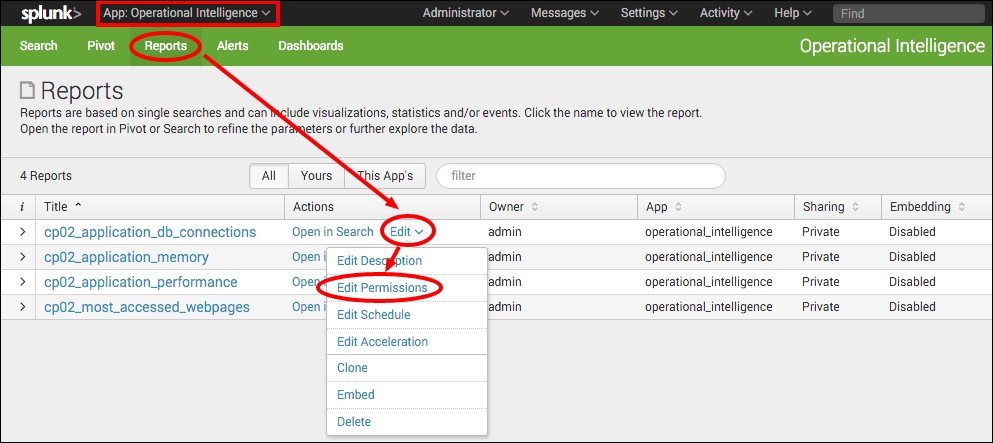
- Ensure that you are in your newly created Operational Intelligence application.
- Select the Reports menu item to see the list of reports.
- Click on Edit next to the report you wish to change the permissions for. Then, click on Edit Permissions from the drop-down list.
- An Edit Permissions pop-up box will appear. In the Display for section, change from Owner to App and then click on Save.
- The box will close and you will see that the sharing permissions in the table now display App for the specific report. This report will now be available to all the users of your application.