
In the previous recipe, you generated an hourly summary, and then, after waiting for 24 hours, you were able to report on the summary data over a 24-hour period. But what if you want to report over the past 30 days or even 3 months? You would have to wait a long time for your summary data to build up. A better way is to backfill the summary data over an earlier time period, assuming you have raw data for this time period in Splunk.
In this recipe, you will create a search that identifies the number of purchases by city on a given day, and write this search to a summary index. You will leverage the IP location database built into Splunk to obtain the city based on IP address in the results. You will then execute a script that comes bundled with Splunk in order to backfill the summary for the previous 30 days. Following this, you will use the generated summary data to quickly report on the number of purchases by city for the past month.
To step through this recipe, you will need a running Splunk Enterprise server, with the sample data loaded from Chapter 1, Play Time – Getting Data In. You should be familiar with navigating through the Splunk user interface and using the Splunk search language.
Follow the steps in this recipe to leverage summary indexing and to backfill the number of purchases by city:
- Log in to your Splunk server.
- Select the Operational Intelligence application.
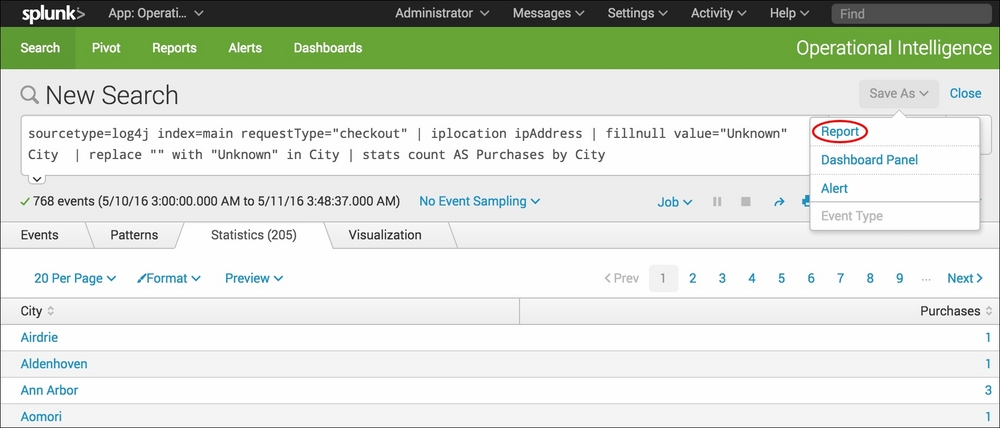
- From the search bar, enter the following search and select to run over Last 24 hours:
sourcetype=log4j index=main requestType="checkout" | iplocation ipAddress | fillnull value="Unknown" City | replace "" with "Unknown" in City | stats count AS Purchases by City
- Click on the Save As dropdown and select Report from the list:
- In the pop-up box that gets displayed, enter
cp09_backfill_purchases_cityas the Title of the report and select No in the Time Range Picker field. Then click on Save: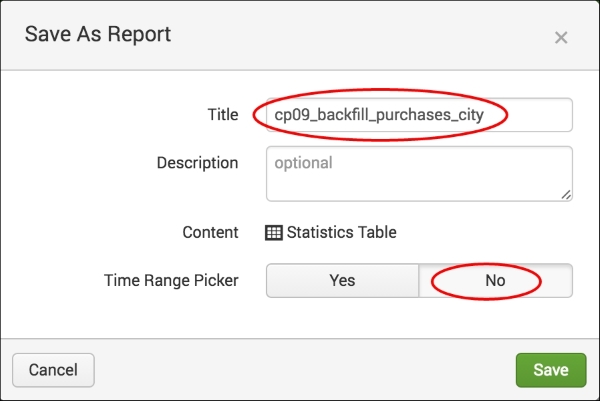
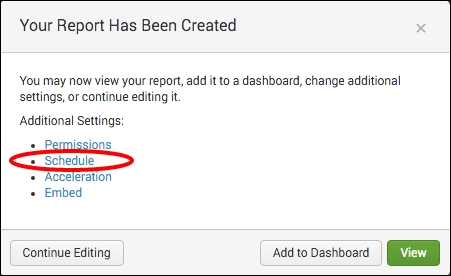
- On the next screen, select Schedule from the list of additional settings:
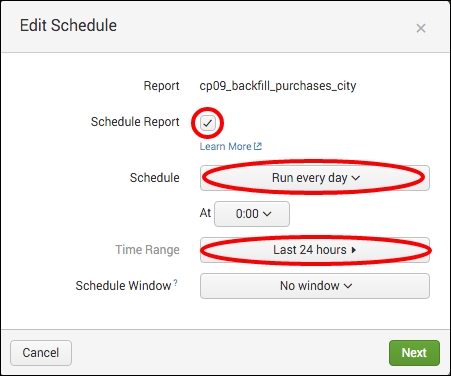
- Select the Schedule Report checkbox, and set Schedule to Run every day and Time Range to Last 24 hours. Click on Next, and then simply click on Save on the next screen:
- You will be taken back to the report you just saved. Select the Edit dropdown, and then select Edit Permissions from the list:
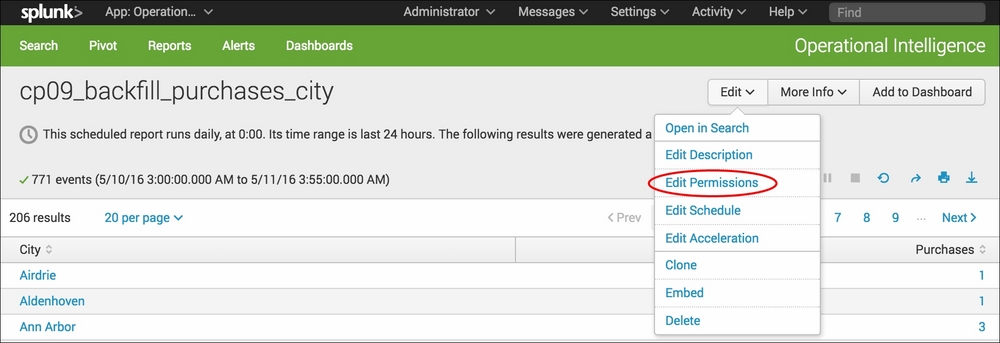
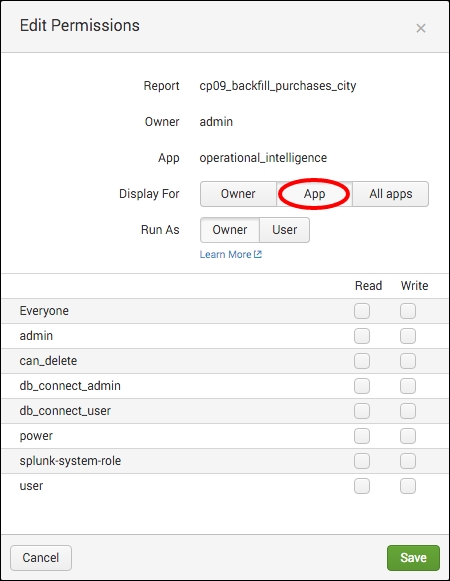
- In the permissions pop-up box that is displayed, select the App option against Display For, and then click on Save:
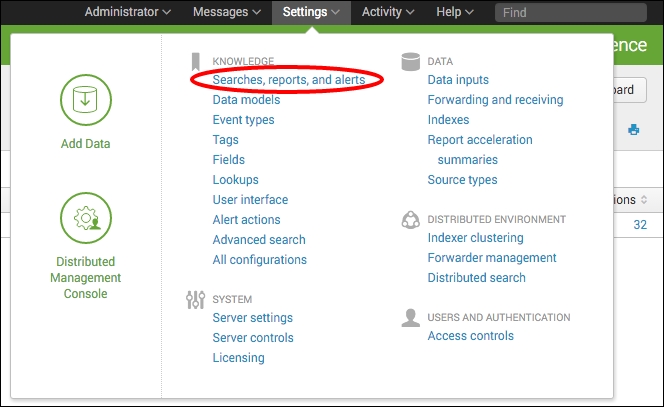
- In order to activate summary indexing on the report that you just saved, you will need to edit the search manually. Click on the Settings menu at the top right and select Searches, reports, and alerts:
- A list of all saved searches will be displayed. Locate the search named
cp09_backfill_purchases_cityand click on it to edit it. - The search editor screen will be displayed. Scroll down to the Summary indexing section at the bottom and select the Enable checkbox. Ensure that the default summary index called summary is selected, and then click on Save:

- The search is now scheduled to run every day, and the results are written to a summary index named summary. Now, you will leverage the script to backfill the summary. Bring up a terminal window in Linux or open a command window in Windows.
- From within your terminal or command window, change your working directory to
$SPLUNK_HOME/bin. - From the command line, tell Splunk to backfill the summary index by executing the
fill_summary_index.pyscript and supplying the required parameters. Execute the following command and change theadmin:changemevalues to theusername:passwordcombination of the user who populates the summary index within Splunk; an administrative login can be used here to ensure proper access to populate the summary index:./splunk cmd python fill_summary_index.py -app operational_intelligence -name cp09_backfill_purchases_city -et -30day@day -lt now -j 8 -auth admin:changeme
- In Windows, omit the
./at the start of the command. - Once the script has completed executing, run the following search from the search bar in the Operational Intelligence application with a time range set to Last 30 days:
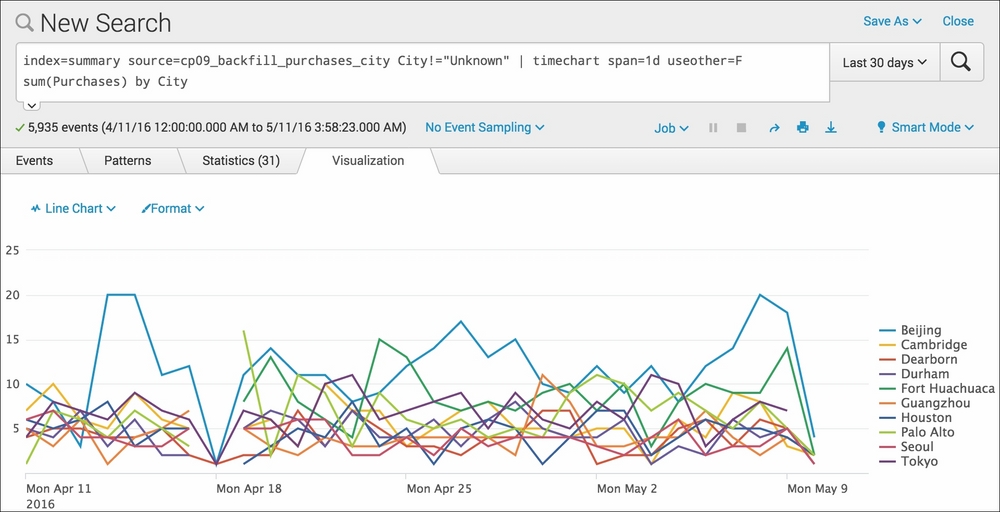
index=summary source=cp09_backfill_purchases_city City!="Unknown"
| timechart span=1d useother=F sum(Purchases) by City
- The search will complete very fast and list one result per day for the last 30 days. Select the Visualization tab to see the data presented as a line chart (change the visualization type if required) representing the total purchases by day for each city over the past month:
- Let's save this chart to our Session and Purchase Trends dashboard that we created in the previous recipe. Click on the Save As dropdown and select Report.
- In the pop-up box that appears, enter
cp09_purchases_city_trendin the Title field and ensure that Visualization is set to Line; then click on Save. - On the next screen, select Add to Dashboard.
- On the Save As Dashboard Panel screen, select Existing as the Dashboard, and then select the Session and Purchase Trends dashboard. Give the panel a title of
Purchases by City – Last 30 Days, and ensure that the panel is powered by Report and Panel Content is set to Line Chart. Then, click on Save to save the chart to the dashboard:
This recipe started off by taking a similar approach to the first recipe in this chapter. You first created a search to look back over the past day for purchases by city and wrote the summarized results to a summary index. You then scheduled this search to run on a daily basis. However, rather than waiting 30 days for data to be populated, you executed a script to backfill the summary with the previous 30 days' worth of data.
The bundled Splunk script inputs a number of variables, including the saved search name (cp09_backfill_purchases_city), the time frame that the search runs over (Last 24 hours), and the period of time that you wish to backfill (Last 30 days). Using this information, the script essentially executes the search 30 times, once for each of the 30 days, and the results of each day are written to the summary. Once the script is successfully executed, you are able to run a report across the summary index over the past 30 days to quickly see the daily purchases by city over time.
There were two searches that you used for this recipe, in addition to a script. The first search was used to generate the summary data and was run daily. The script used the first search to backfill the summary with 30 days of data. The second search was used to search and report against the summary data directly. Let's break down each search piece by piece:
Search 1 – summary index generating search
|
Search fragment |
Description |
|---|---|
sourcetype=log4j index=main requestType="checkout" |
We first select to search the application data in the main index over the past day. We select to search for only events with a |
| iplocation ipAddress |
Using the built-in |
| fillnull value="Unknown" City | replace "" with "Unknown" in City |
The |
| stats count AS Purchases by City |
Using the |
fill_summary_index.py – backfilling the summary index
Search 2 – reporting off the summary index
In this recipe, you leveraged a script to help backfill the index automatically in Splunk. However, in many cases, access to the command line to execute scripts might not be permitted, and/or you won't mind doing a little bit more work to backfill a summary if it means you can do it directly from the search bar within Splunk.
Splunk provides a way to write to a summary index directly from the search using the
addinfo and collect commands. For example, using the summary-generating search in this recipe, we can modify the search to directly write to the summary index, as follows:
sourcetype=log4j index=main requestType="checkout" earliest=-2d@d
latest=-1d@d
| iplocation ipAddress | fillnull value="Unknown" City
| replace "" with "Unknown" in City
| stats count AS Purchases by City
| addinfo | collect index=summary
source="cp09_backfill_purchases_city" addtime=t
The earliest and latest field values are used to set the time range that the search should run over. In this case, we run the search over the previous day, starting 2 days ago and ending 1 day ago. We also add the addinfo command, which adds information that Splunk needs for summary indexing. Additionally, we use the collect command and specify the summary index as well as the value for the source field that is written to the summary. The source field value we use is the name of the saved search. If you execute this search, it will write a day's worth of data to the summary index. You can repeat this search, modifying the earliest and latest field values back a day each time until you run the search 30 times and backfill the entire month. You can also use the append command to append 30 searches together, each with a different earliest and latest time. It is a bit uglier than the script method used in the recipe and more prone to user error, but it works.
Tip
With summary indexing, it is very easy to write data to an index that you don't want. Perhaps, you duplicate the data or tweak your generating search to correct the results. Splunk has a delete command that can be used to clean out bad data from any index. However, you will likely need to have your Splunk administrator delete the data for you.