
As we saw in the Adding a force-directed graph of web hits and Adding a calendar heatmap of product purchases recipes, visualizing data with charts can be a great way to gain visibility of the meaning of your data. But sometimes, due to the nature and the type of data, there are cases where a table is the easiest way to represent it visually. In this case, we can get some added benefits by highlighting specific cells based on some logic that we can control.
This recipe will show you how to create a new dashboard panel containing a table of purchase locations for the past week, highlight a cell based on the average purchase price, and place it in the Operational Intelligence application.
To step through this recipe, you will need a running Splunk Enterprise server, with the sample data loaded from Chapter 1, Play Time – Getting Data In. You should be familiar with navigating the Splunk user interface and using the Splunk search language. Some basic knowledge of JavaScript, CSS, and HTML is recommended.
Follow the steps in this recipe to create a new dashboard panel that contains a table of purchase locations for the past week:
- Log in to your Splunk server.
- Select the Operational Intelligence application.
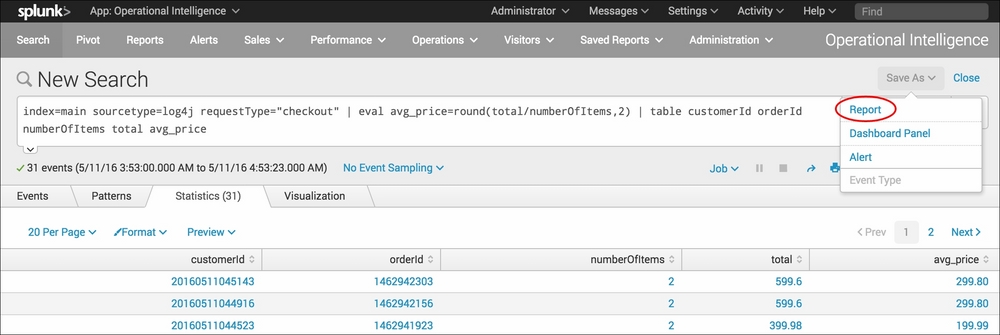
- From the search bar, enter the following search and select to run over Last 60 Minutes:
index=main sourcetype=log4j requestType="checkout" | eval avg_price=round(total/numberOfItems,2) | table customerId orderId numberOfItems total avg_price
- Click on the Save As dropdown and select Report from the list:
- In the pop-up box that gets displayed, enter
cp10_average_checkout_product_priceas the title of the report and select No in the Time Range Picker field; then, click on Save: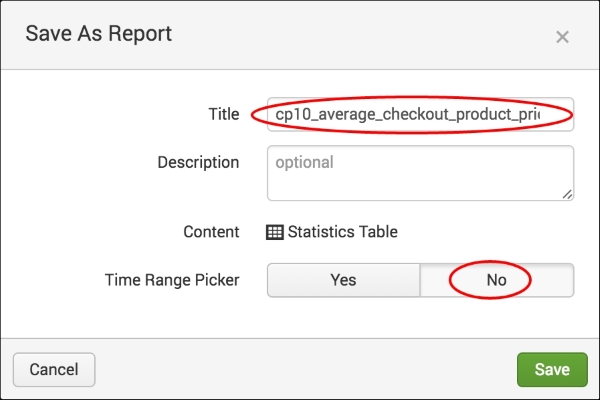
- On the next screen, click on the Add to Dashboard button.
- In the pop-up box that appears, select Existing and select Product Monitoring. Give the panel you are adding a title of
Average Checkout Product Price. Ensure that the panel is powered by Report and then click on Save to create the new dashboard with the statistics table:
- Click on View Dashboard to see the panel that has been added to your Product Monitoring dashboard.
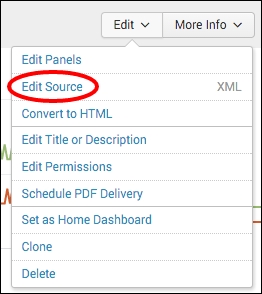
- Click on the Edit button and select Edit Source:
- In the opting
<dashboard>tag, update it with ascriptattribute:<dashboard script="cp_10_table_cell_highlight.js">
- Locate the
<table>tag of the panel that was just added and update the tag with anidattribute:<table id="cp10_highlight"> <title>Average Checkout Product Price</title> <search ref="cp10_average_checkout_product_price"></search> </table> - Click on Save.
- From a console window or a file explorer window, go to the
$SPLUNK_HOME/etc/apps/operational_intelligencedirectory and create anappserverfolder and then astaticfolder (if not already created) so that the complete path is now$SPLUNK_HOME/etc/apps/ operational_intelligence/appserver/static. - In the
$SPLUNK_HOME/etc/apps/ operational_intelligence/appserver/staticdirectory, create thecp_10_table_cell_highlight.jsfile and add the following code to it:require([ 'underscore', 'jquery', 'splunkjs/mvc', 'splunkjs/mvc/tableview', 'splunkjs/mvc/simplexml/ready!' ], function(_, $, mvc, TableView) { var CustomRangeRenderer = TableView.BaseCellRenderer.extend({ canRender: function(cell) { return _(['avg_price']).contains(cell.field); }, render: function($td, cell) { var value = parseFloat(cell.value); if (value > 1000) { $td.addClass('range-cell').css('background-color','#d59392'); } else if (value > 200) { $td.addClass('range-cell').css('background-color','#ffc57a'); } $td.text(value.toFixed(2)).addClass('numeric'); } }); mvc.Components.get('cp10_highlight').getVisualization(function(tableView) { tableView.addCellRenderer(new CustomRangeRenderer()); }); }); - Restart Splunk.
- Log in to your Splunk server.
- Select the Operational Intelligence application and return to the Product Monitoring dashboard.
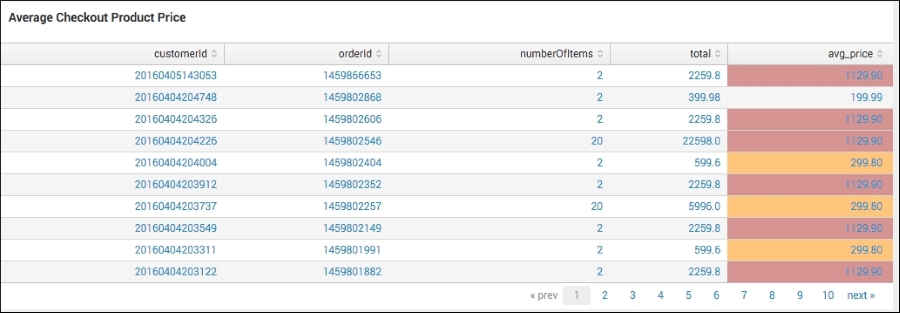
- You should now see the cells of the avg_price column highlighted based on the amount:
Search fragment
Description
index=main sourcetype=log4j requestType="checkout"
You should be familiar with this search from the recipes in previous chapters. It is used to return events from the application logs. For this search, we just take the checkout requests.
| eval avg_price=round(total/numberOfItems,2)
Using the
evalcommand, we calculate the average price per product by taking the total amount spent over the total number of items purchased. We then round the average to two significant digits.| table customerId orderId numberOfItems total avg_price e
Using the
tablecommand, we return just the fields we want to see in our table and the order in which we want to see them.
First, we created a search. Let's break it down piece by piece:
We add this search as a report and then a dashboard panel so that we can add our custom highlighting. To add the highlighting, we include our custom JavaScript file in the app. This file contains all of the custom logic for adding our cell highlighting.
Let's break down the JavaScript:
|
Search fragment |
Description |
|---|---|
require([
    'underscore',
    'jquery',
    'splunkjs/mvc',
    'splunkjs/mvc/tableview',
    'splunkjs/mvc/simplexml/ready!'
], function(_, $, mvc, TableView) { |
This code tells JavaScript which modules to load and the objects in which to make them available within the script. |
    var CustomRangeRenderer = TableView.BaseCellRenderer.extend({
        canRender: function(cell) {
            return _(['avg_price']).contains(cell.field);
}, |
We then create our custom table renderer by extending the base cell renderer object. Next, we implement a |
        render: function($td, cell) {
            var value = parseFloat(cell.value);
            if (value > 1000) {
                $td.addClass('range-cell').css('background-color','#d59392');
            }
            else if (value > 200) {
                $td.addClass('range-cell').css('background-color','#ffc57a');
            }
$td.text(value.toFixed(2)).addClass('numeric');
        }
}); |
We then create a |
mvc.Components.get('cp10_highlight').getVisualization(function(tableView) {
        tableView.addCellRenderer(new CustomRangeRenderer());
}); |
Finally, we tell JavaScript which ID to bind this custom table renderer to and pass it the reference to our custom object. |
Splunk allows you to include custom JavaScript and CSS with dashboards. This allows you to tap the full power of the Web Framework and SplunkJS without having to use custom HTML dashboards.
By updating the <dashboard> tag, you can also include custom CSS styles or modify existing styles within the dashboard. Include the stylesheet attribute and the CSS file in the same $SPLUNK_HOME/etc/apps/ operational_intelligence/appserver/static directory:
<dashboard script="cp_10_table_cell_highlight.js" stylesheet="cp_10_table_cell_highlight.css">