Form searches in Splunk do not need to be limited to displaying events and table-driven data. Rich visualizations can also be linked to forms and be updated when the forms are submitted.
This recipe will show you how you can extend a form to include charts and other visualizations that can be driven by the form created to show visitor traffic and location data.
To step through this recipe, you will need a running Splunk Enterprise server, with the sample data loaded from Chapter 1, Play Time – Getting Data In, and you should have completed the earlier recipes in this chapter. You should also be familiar with navigating the Splunk user interface.
Follow these steps to add a web page activity chart and link it to a form:
- Log in to your Splunk server.
- Select the default Operational Intelligence application.
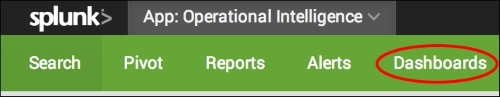
- Select the Dashboards menu item.
- Select the Visitor Monitoring dashboard.
- Click on the Edit button and then on Edit Panels.

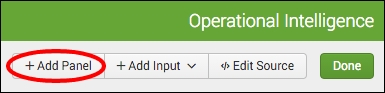
- Click on the Add Panel button.
- From the fly-out panel, expand the New section and then click on Line.
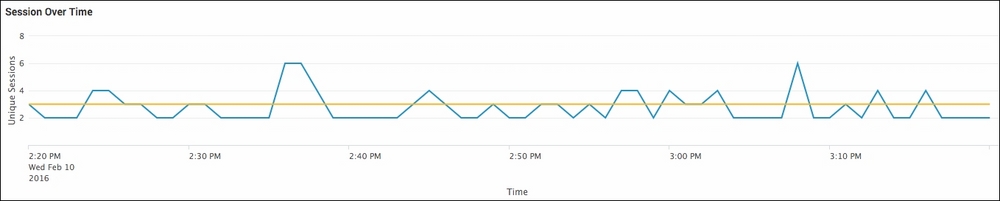
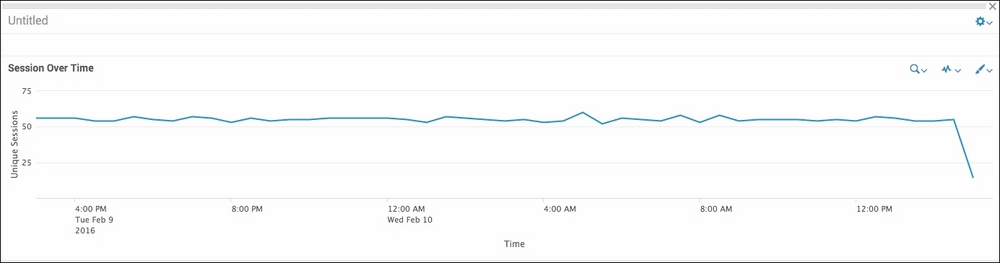
- Set the Content Title panel to Session Over Time.
- Set the Search String field to the following:
index=main sourcetype=access_combined clientip="$ip$" | iplocation clientip | fillnull value="Unknown" City, Country, Region| replace "" with "Unknown" in City, Country, Region | search City="$city$" Region="$region$" Country="$country$" | timechart dc(JSESSIONID)
- Set the Time Range Scope field to Shared Time Picker (field1).

- Click on Add to Dashboard.
- Click anywhere on the dashboard to make the fly-out panel disappear.
- Click on the edit panel icon in the panel we just added to the dashboard.
- Update the X-Axis label with Custom Title set to Time.
- Update the Y-Axis label with Custom Title set to Unique Sessions.
- Set the Legend option to None.
- Click on Apply. The pop-up box will disappear with the changes reflected on the panel.
- Next, click on Done to finish editing the dashboard.

- Filter by an IP of 134 or similar again, and you should see that the chart panel also changes along with the table panel.
Adding a chart to the dashboard works in a manner very similar to the way in which the original form was created. You can utilize the field variables defined in the form in the inline search that is used for the chart. Splunk will set them when the form is submitted. The panel can also utilize the time range that was used in the form or contain a separate time range drop-down.
By building a form and several different charts and tables, you can build a very useful form-driven dashboard. One of the great uses of a form-driven dashboard is for investigative purposes. In this example, you can take any of the fields and, for instance, see all sessions that are coming from a particular country and then see the level of activity over the time period you are interested in.
Additional customizations can be added to the charts in order to give them more meaning.
You can have Splunk overlay a field value on top of your existing chart to provide trendlines and so on. Add the following line to the end of the inline search used for the Sessions Over Time search:
| eventstats avg(dc(JSESSIONID)) as average | eval average=round(average,0)
Then, add the following line to the Simple XML of the panel:
<option name="charting.chart.overlayFields">average</option>
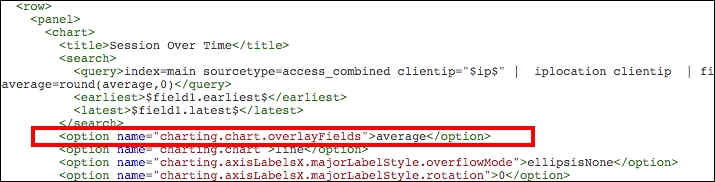
It will then add a line that charts the average of the session count over top of the actual values. The chart overlay functionality can also be added from the panel editor under the edit panel icon.