
It seems that every device being created and sold today has the ability to be "smart" and can sit on your network sending data about what it has been doing. The ability to capture this data in real time and integrate it into other business data is a critical step for enhancing your operational intelligence.
In this recipe, you will learn how to use the Splunk HTTP Event Collector to receive data from a remote scanning device that collects inventory levels of products from your warehouse. The scanning device has been configured to send HTTP requests with a custom JSON object indicating what it has just scanned, versus the traditional process of waiting until the end of the day to download its data.
To step through this recipe, you will need a running Splunk Enterprise server, with the sample data loaded from Chapter 1, Play Time – Getting Data In. You should be familiar with navigating the Splunk user interface and using the Splunk search language. This recipe will use the open source command-line tool, curl. There are also other command-line tools available, such as wget. The curl tool is usually installed by default on most Mac and Linux systems but can be downloaded for Windows systems as well.
Note
For more information on curl, visit http://curl.haxx.se/.
Perform the steps in this recipe to create a custom search command to format product names:
- Log in to your Splunk server.
- Select the Operational Intelligence application:

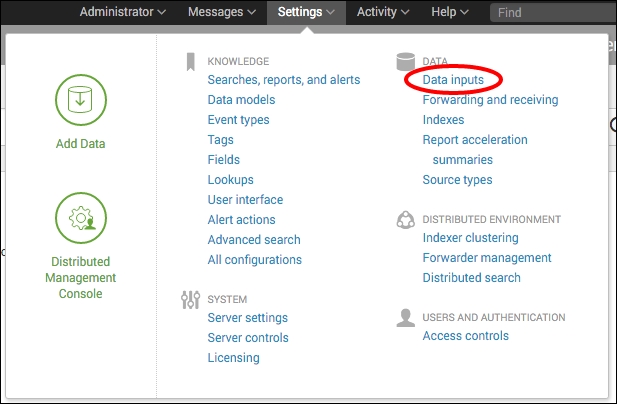
- Click on Settings and then on Data inputs:
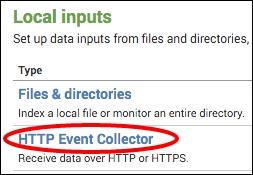
- Click on HTTP Event Collector:
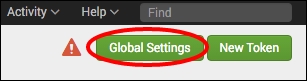
- Then click on the Global Settings button:
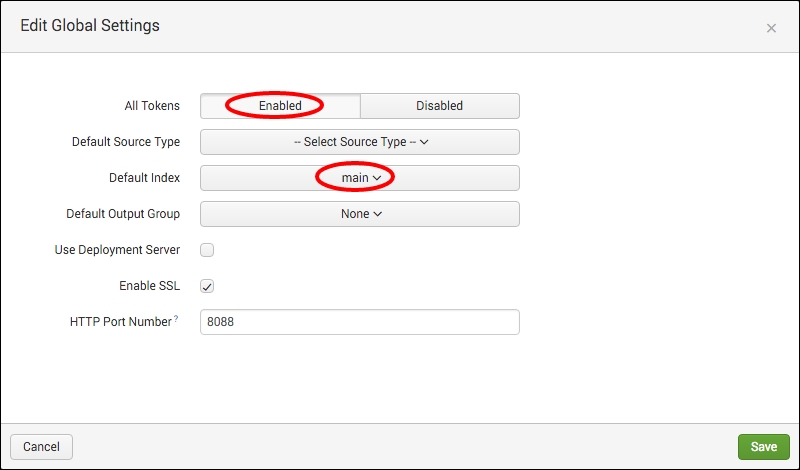
- Set All Tokens to Enabled and Default Index to main. Then click on the Save button:
- Click on the New Token button:

- Set Name to
Inventory Scannerand Source name override toinventory:scanner, and click on the Next button:
- Select New for the source type and enter
inventory:scanneras the value: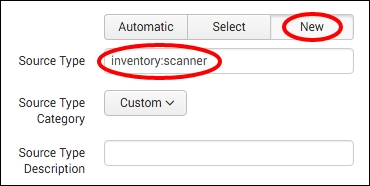
- Click on main so that it gets moved to the Selected Item(s) list, and click on the Review button:

- Then click on Submit.
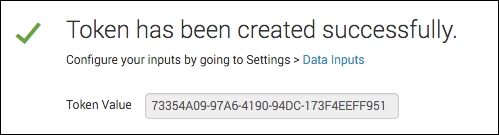
- After the form submits, you will be presented with the token:
- Open a console or command-line window on your Splunk server.
- You can now simulate your scanner sending data by create an HTTP request from the command line using the new token for authentication:
curl -k https://localhost:8088/services/collector/event -H "Authorization: Splunk 73354A09-97A6-4190-94DC-173F4EEFF951" -d '{"event": { "itemId": "1000015", "count": "200" } }' - You should receive a success message back if the request was processed correctly:
{"text":"Success","code":0} - Log in to Splunk.
- Select the Operational Intelligence application.
- In the search bar, enter the following search over Last 24 hours:
index=main sourcetype=inventory:scanner
- You should now see your simulated scanner entries as JSON events:

In order to get the HTTP Event Collector to work, you first need to configure the global settings. This defines the HTTP endpoint it will listen on—typically, port 8088. This single port can receive multiple types of data since it is all differentiated by the token that is passed with it, and also by interpreting the data within the payload of the request. Other global defaults can be set, such as the index and the sourcetype.
To then set up the HTTP Event Collector for a specific data input, we need to create a token. When setting up a token, you define a number of defaults—the default index and default sourcetype. These values will be used unless the data itself contains the values to use. The set of indexes that can be used by that token also has to be specified so that someone cannot craft a custom event that could be routed to the wrong index.
Finally, we simulate the sending of an event using the Linux curl utility. We specify the token in an authorization header and then send the data we are posting as a JSON object. The data passed in the event field is what Splunk will interpret as the data for the event.
By leveraging the HTTP Event Collector, any number of new data sources can be indexed by Splunk and this allows you to create better visibility and operational intelligence.
Note
For more information on how to use the HTTP Event Collector, check out the documentation at http://dev.splunk.com/view/event-collector/SP-CAAAE6M.