
Typically, when analyzing web requests, events often overlap with one another due to multiple users issuing requests concurrently. By identifying these overlapping requests, and further understanding the concurrency of events, you will gain a clearer picture of the true demand for both the resources and consumer demands.
In this recipe, you will write a Splunk search to find the number of concurrent checkouts over a given period of time. You will then graphically display this value on a dashboard using the line chart visualization.
To step through this recipe, you will need a running Splunk Enterprise server, with the sample data loaded from Chapter 1, Play Time – Getting Data In. You should have also completed the earlier recipes in this chapter and be familiar with navigating the Splunk user interface.
Follow the steps in this recipe to identify the number of concurrent checkouts over a given period of time:
- Log in to your Splunk server.
- Select the Operational Intelligence application.
- Ensure the time range picker is set to Last 24 hours and type the following search into the Splunk search bar. Then, click on the search button or hit Enter.
index=main sourcetype=access_combined | transaction JSESSIONID startswith="GET /home" endswith="checkout" | concurrency duration=duration | timechart max(concurrency) AS "Concurrent Checkouts"
- After a short while, Splunk will return the values associated with the maximum concurrent checkouts split in 30-minute durations.
- Click on the Visualization tab.
- Since there are a number of visualizations within Splunk, the line chart visualization might not be displayed by default within the Visualization tab. Click on the dropdown listing the visualization types and select Line.

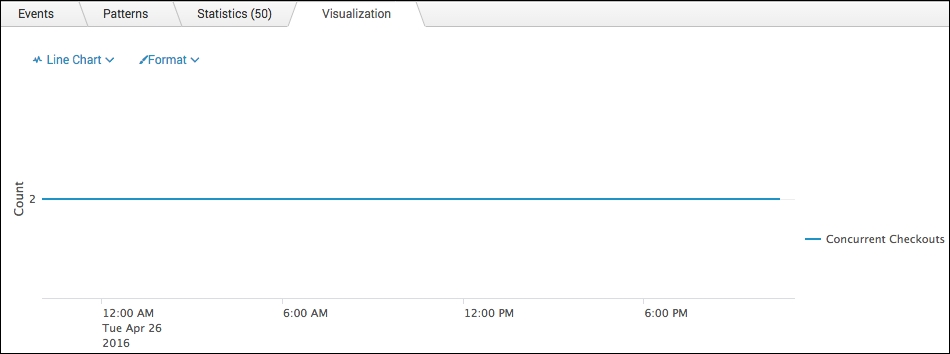
- You should now see the value represented as line chart visualization.
- Let's add more context to the visualization and correct some values. Click on Format and then click on the Y-Axis tab. Click on the dropdown Title menu and choose Custom. Enter
Countas the title and click anywhere on the page.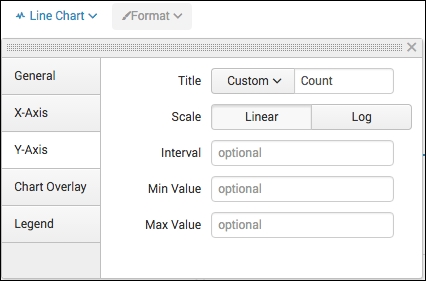
Your line chart visualization should now look similar to the following example:
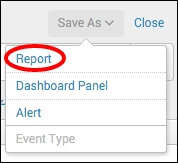
- Let's save this search as a report. Click on Save As and choose Report from the drop-down menu.
- In the pop-up box that appears, enter
cp06_concurrent_checkoutsin the Title field and then click on Save.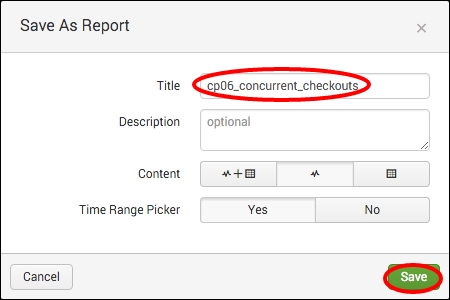
- You will receive a confirmation that your report has been created. Now, let's add this report to a dashboard. In the next window, click on Add to Dashboard.

- You add this report to the Session Monitoring dashboard that was created in an earlier recipe. In the Save As Dashboard Panel pop-up box, click on the Existing button beside the Dashboard label. From the drop-down menu that appears, select Session Monitoring. Enter Maximum Concurrent Checkouts in the Panel Title field and ensure the panel is powered by Report. Then, click on Save.

-
- You can now click on View Dashboard to see the panel on your Session Monitoring dashboard.
Let's break down the search piece by piece:
|
Search fragment |
Description |
|---|---|
|
|
You should be familiar with this search from the earlier recipes in this chapter. It is used to return events from the website access log. |
|
|
Using the |
|
|
The |
|
|
The |
The concurrency command is a useful way of calculating concurrent events without using too much logic. In this recipe, you were able to use the command to identify the maximum amount of concurrent checkouts throughout the day.
Note
For more information on the concurrency command, visit http://docs.splunk.com/Documentation/Splunk/latest/SearchReference/Concurrency.