
As you have seen from the other recipes throughout the book, we have used many of the normal everyday visualizations seen commonly in spreadsheets and presentations. As data intelligence tools such as Splunk push the boundaries of getting data into a user's hands, there is a need to deliver and represent data via new and unique visualizations.
This recipe will show you how to install the Splunk web framework and create a force-directed graph (FDG) of relationships between web page hits that will be populated as a new dashboard in the Operational Intelligence application.
To step through this recipe, you will need a running Splunk Enterprise server, with the sample data loaded from Chapter 1, Play Time – Getting Data In. You should be familiar with navigating the Splunk user interface and using the Splunk search language. Some basic knowledge of JavaScript is recommended.
You will also need to download the Splunk Web Framework Toolkit app from Splunkbase. This app can be found here: https://splunkbase.splunk.com/app/1613/.
Follow the steps in this recipe to add a force-directed graph that illustrates web hits:
- Log in to your Splunk server.
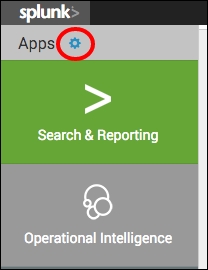
- From the Apps menu in the upper left-hand corner of the home screen, click on the gear icon:
- The Apps settings page will load. Then click on the Install App from file button.
- Click on the Choose File button and select the app file that was previously downloaded from Splunkbase. Then click the Upload button:

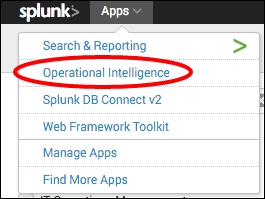
- Select the Operational Intelligence application from the Apps menu:
- Click on the Administration menu and then click the Dashboards menu item.
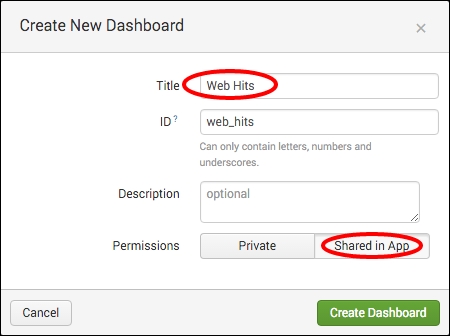
- Click on the Create New Dashboard button.
- In the Create New Dashboard window, enter
Web Hitsin the Title field and select Shared in App in the Permissions field. - Click on Create Dashboard:
- Then click on Done:

- Click on the Edit button and select the Convert to HTML menu item:

- Select the Replace Current option and click on Convert Dashboard:

- Click on the Edit HTML button:

- In the dashboard editor form, locate the HTML
<div>tag with thedata-role=mainvalue and update it to look like the following code:<div class="dashboard-body container-fluid main-section-body" data-role="main"> <div class="dashboard-header clearfix"> <h2>Web Hits</h2> </div> <div class="dashboard-row dashboard-row1"> <div class="dashboard-cell" style="width: 100%;"> <div class="dashboard-panel clearfix"> <div class="panel-element-row"> <div class="dashboard-element chart" id="element1" style="width: 100%"> <div class="panel-head"> <h3>Webpage relationship</h3> </div> <div class="panel-body"> <div id="fd-chart"></div> </div> </div> </div> </div> </div> </div> </div> - Locate the
require.configstatement just below and insert the additional path that will help Splunk find the toolkit components. Add the app path as follows (remember to add a comma to the preceding array item):require.config({ baseUrl: "{{SPLUNKWEB_URL_PREFIX}}/static/js", waitSeconds: 0, // Disable require.js load timeout paths: { "app": "../app" } }); - Locate the
requireportion of the JavaScript just below and add this item to the array (remember to add a comma to the preceding array item):"app/splunk_wftoolkit/components/forcedirected/forcedirected" - Below the
functionstatement, addForceDirected(remember to add a comma to the preceding array item):PostProcessManager, UrlTokenModel, ForceDirected
- Locate the
SEARCH MANAGERSsection of the JavaScript and add the following code:var search1 = new SearchManager({ "id": "search1", "status_buckets": 0, "latest_time": "now", "search": " index=main sourcetype=access_combined | rex field=referer ".*(?<sourcepage>/.*?)$" | eval group=uri_path | stats count by sourcepage, uri_path, group", "cancelOnUnload": true, "earliest_time": "-6h", "app": utils.getCurrentApp(), "auto_cancel": 0, "preview": true }, {tokens: true, tokenNamespace: "submitted"});
- Locate the
VIEWS: VISUALIZATION ELEMENTSsection of the JavaScript (close to the bottom of the page) and add the following code:var forcegraph = new ForceDirected({ 'id' : 'fd1', 'managerid' : 'search1', 'el' : $('#fd-chart') }).render();
- Click on Save, and you will be taken back to the dashboard.
- After a short while, you should see the force-directed graph load on your dashboard. This shows the relationships between pages and page transitions:
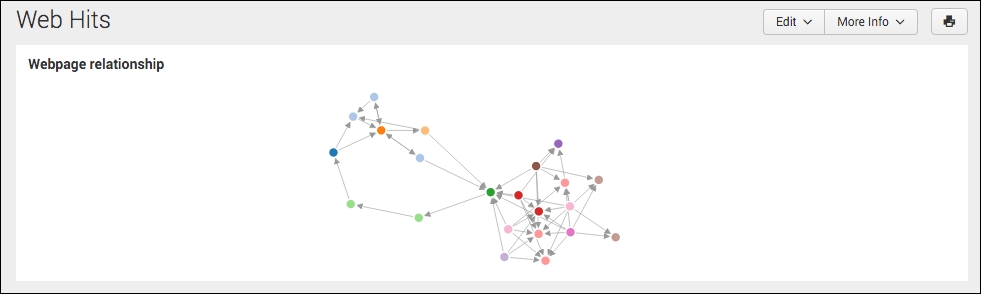
Splunk provides the Web Framework Toolkit app to help demonstrate how different libraries can be used to create visualizations such as the force-directed graph. This app comes with prebuilt D3.js visualizations that we can use in our own apps. Force-directed graphs are visualizations that render the connectivity and clustering between objects. The typical force-directed drawing algorithm places similar objects in closer proximity to each other and unrelated objects farther apart.
In order to use the toolkit and FDGs, you first had to install the necessary app. You could copy the required libraries over to the Operational Intelligence application if your app is going to be distributed as it reduces dependency on other apps being installed.
The dashboard had to be in the HTML format for the FDG to be inserted, so you created an empty dashboard in SimpleXML and then converted it to HTML. You then added the HTML code that will hold the FDG, and ensured that it was set with all the correct CSS classes in order to ensure that the formatting matches the app.
The majority of the dashboard functionality comes in the JavaScript section. You first added references to the libraries that you copied into the Operational Intelligence app from the Web Framework Toolkit. You then added a search manager object that controls the searching functionality and returns the data to the graph object. Finally, you added an object that will hold the FDG and told it which HTML entity it is to be put in.
Note
A good walkthrough of HTML can be found on the Splunk developer website at http://dev.splunk.com/view/webframework-htmldashboards/SP-CAAAETK.
Additionally, to learn more about D3.js and the types of visualizations that you can create with it, visit http://d3js.org/.
Splunk is very flexible, and there are a few tweaks we can make to improve or modify the behavior of the dashboard.
The search manager JavaScript object controls and coordinates the search requests, and as such, it can be modified with different settings to control the different aspects of its behavior.
One of the parameters that can be modified easily is the time range. This can be done by hardcoding a new value or linking it with other controls such as dropdowns or textboxes.
To change the search time range from the previous 6 hours to the current business week, update the search manager attributes of latest_time and earliest_time as shown in the following code:
var search1 = new SearchManager({
    "id": "search1",
    "status_buckets": 0,
    "latest_time": "+7d@w6",
    "search": "index=main sourcetype=access_combined | rex field=referer ".*(?<sourcepage>/.*?)$" | stats count by sourcepage, uri_path",
    "cancelOnUnload": true,
    "earliest_time": "@w1",
    "app": utils.getCurrentApp(),
    "auto_cancel": 0,
    "preview": true
}, {tokens: true, tokenNamespace: "submitted"});