A very powerful feature of Splunk is the ability to trigger alerts based on specific conditions in real-time events. From the perspective of operational intelligence, real-time alerting provides the ability to be notified of something that requires immediate action. Real-time alerting in Splunk is based upon an underlying real-time search.
In this recipe, you will create a real-time alert that will trigger any time there is an error during the checkout stage of our online store. The checkout stage in the purchasing process is where the payment details are submitted by the customer and our sales transactions ultimately occur. Errors here can result in lost sales revenue and lost customers. It is, therefore, important to immediately understand if errors occur so that they can be remediated as soon as possible.
To step through this recipe, you will need a running Splunk Enterprise server, with the sample data loaded from Chapter 1, Play Time – Getting Data In. You should be familiar with navigating the Splunk user interface. You should also have configured the e-mail settings on your Splunk server to enable the delivery of e-mail alerts.
Follow the steps in this recipe to create a real-time alert when checkout errors occur:
- Log in to your Splunk server.
- Select the Operational Intelligence application.
- In the Search bar, enter the following search:
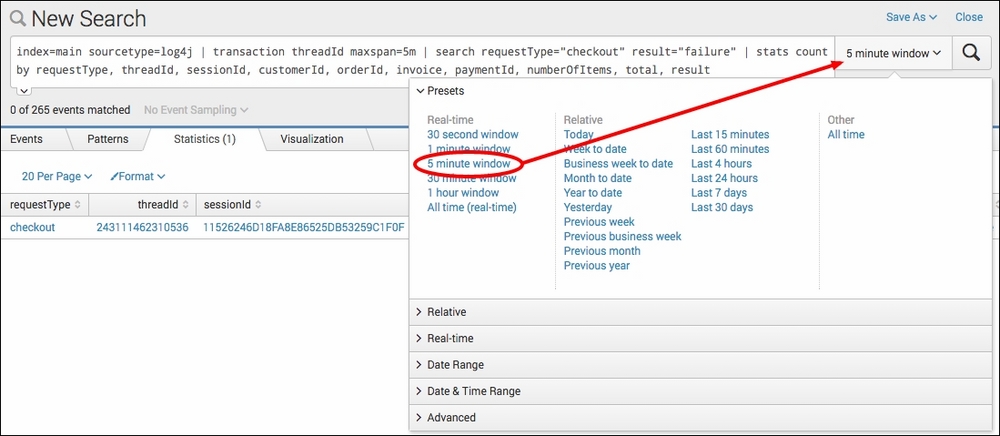
index=main sourcetype=log4j
| transaction threadId maxspan=5m
| search requestType="checkout" result="failure"
| stats count by requestType, threadId, sessionId, customerId, orderId, invoice, paymentId, numberOfItems, total, result
- Change the search time period to a 5-minute window by selecting 5 minute window from the real-time Presets column on the time range picker.
- The search will run but might not produce any results if there are no results to display. This is okay. Click on the Save As dropdown and select Alert.

- A pop-up box will appear to provide the alert configuration options. Perform the following steps on this screen:
- Give the alert the Title
cp08_realtime_checkout_error. - Select Shared in App as Permissions.
- Select Real Time in the Alert type field.
- Change the Trigger alert when field to Number of Results.
- Select Is greater than and enter
0in the associated textbox. - Enter
5in the In textbox beside the minute(s) dropdown. - Select For each result as Trigger.
- Select the Throttle checkbox.
- In the Suppress results containing field value textbox, enter
threadId. - In the Suppress triggering for textbox, enter
600and select second(s) from the dropdown.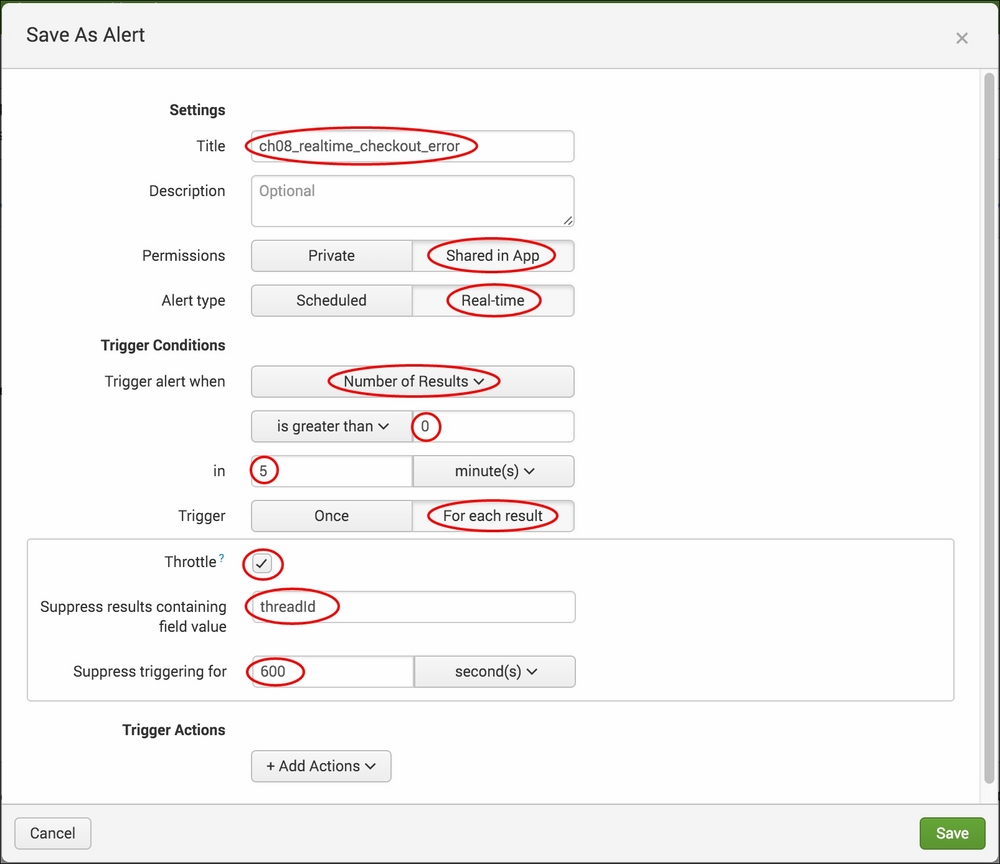
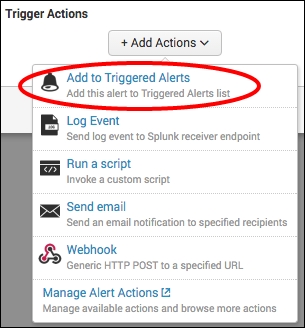
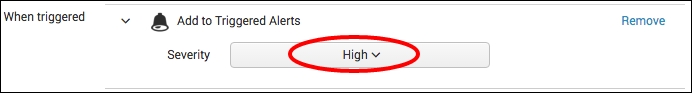
- Click on Add Actions. Select Add to Triggered Alerts from the Add Actions dropdown.
- From the Severity dropdown, select High.
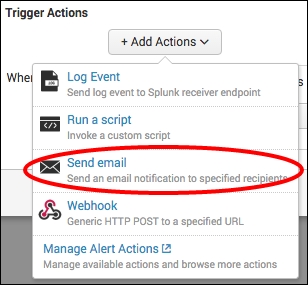
- Click on Add Actions. Select Send email from the Add Actions dropdown.
- Enter a valid e-mail address in the To box; this is where the alert will go to.
- In the Priority dropdown, select High.
- In the Include section, check Link to Alert, Link to Results, Inline Table, and Trigger Time. These settings will ensure that there are links in the e-mail to both the alert and the results in Splunk. The Inline Table option will tabulate the results in the e-mail body.
- In the Type section, select HTML & Plain Text.

- Verify that the given details are entered correctly, and then click on Save.
- Give the alert the Title
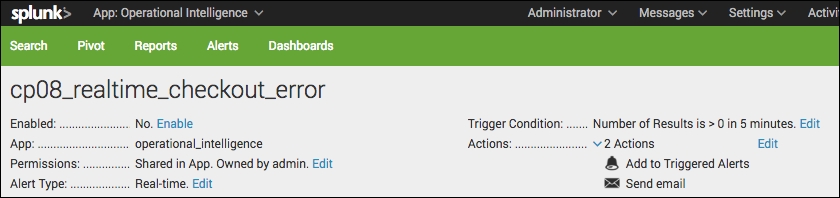
- Click on View Alert. A summary screen should be displayed and the alert is now mostly configured.
When the alert triggers, you should receive an e-mail similar to the following screenshot. Note that Trigger Time and the key fields from the data are included in the e-mail body as an inline table, as specified when configuring the alert.

This recipe was a little complex, so let's step through it methodically. In this recipe, we were looking at identifying checkout failures. To do this, the search looked for failure events in the application logs at the checkout stage. Specifically, we were looking for database update response failures, where payment information had been submitted to the backend application database but a failure had been returned in the logs. The web application log events are broken into transactions known as threads. Each thread has a common threadId to link them together, and the events within a unique thread typically consist of requests and responses. The real-time search was set to look over a 5-minute window, as a distinct thread is unlikely to take longer than this.
Let's break down the search piece by piece:
|
Search fragment |
Description |
|---|---|
index=main sourcetype=log4j |
We selected to search the application logs in the main index. |
| transaction threadId maxspan=5m |
Using the |
| search requestType="checkout" result=failure |
Once the events were grouped into transactions by |
| stats count by requestType, threadId, sessionId, customerId, orderId, invoice, paymentId, numberOfItems, total, result |
If/when a failure event occurs, the |
In this recipe, we used a rolling-window alert type and set the search to run over a 5-minute real-time rolling window. This window allows for all events in a single thread transaction to occur.
When configuring the alert, we selected the alert to trigger whenever one or more events occurred that matched the failure condition, as we wanted to be notified whenever an error occurred. We also chose to execute an action for each result, as each result would pertain to a new error. This meant that if we got two errors back at once, then two alerts would be triggered, one for each error. We selected to throttle the alert on threadId so that an alert for a unique threadId would not be triggered more than once. This throttling is sensible, as there is no need to know about the same error over and over again. We selected to throttle the alert for 600 seconds, or 10 minutes, meaning that no further alerts would be triggered for a given threadId for 10 minutes. However, if the error reoccured after 10 minutes for the same threadId, then another alert would be triggered. In this case, the threadId in our events is unique, so the likelihood of a reoccurrence of a transaction with the same threadId is zero.
Within the e-mail itself, we specified to include the results as an inline table and to include the trigger time. These inclusions help make the alert a lot more actionable to the person at the receiving end. The trigger time lets the receiver know exactly when the failure event occurred, and the inline table contains key information related to the event. This helps ensure that the receiver of the alert has all the information he/she needs to investigate, without needing to log in to Splunk and run additional searches.
This recipe was as much about real-time alerting as it was about real-time searching. Real-time searching has limited value on its own, unless you are staring at the screen, waiting for data to come into Splunk. However, when paired with alerting, this functionality really comes into its own. Real-time searches and alerts can be more taxing on system resources than their scheduled counterparts, so care should be taken to ensure that they are efficient and delivering value. The Jobs screen can be helpful in understanding which real-time searches are running on your system. Additionally, alerts can be configured directly by editing a configuration file in a manner similar to editing searches.
Tip
Indexed real-time searches can be enabled to increase performance and reduce the amount of system resources used by real-time searching and alerting in Splunk. For more information on this, review the documentation at http://docs.splunk.com/Documentation/Splunk/latest/Search/Aboutrealtimesearches.
As alerts are just extensions of Splunk searches, the underlying configuration details related to an alert are written to the app's local directory in a file named savedsearches.conf alongside the search.
The savedsearches.conf file for our Operational Intelligence application is located at $SPLUNK_HOME$/etc/apps/operational_intelligence/local/savedsearches.conf.
If you open this file, you will see entries related to the two searches and alerts you have created in this chapter till now. Note all the additional configuration fields that specify the alert criteria. If you were to copy and paste one of the searches and all the fields but give it a new name ([name]), it would create a duplicate alert inside Splunk. Changes made to this .conf file will require us to restart Splunk, as with many other .conf file changes.
You might be wondering why you need to configure an alert via savedsearches.conf. It can be useful if you want to create multiple alerts where the alert configuration is mostly similar, but the underlying search is slightly different. Editing savedsearches.conf directly will likely be a lot quicker than going into the GUI and setting up each alert one by one.
All attributes found within the savedsearches.conf file can be edited through the Advanced edit option within the Splunk GUI by navigating through the Settings menu at the top left and clicking on Searches, reports and alerts. The resulting screen will list all the existing searches, reports, and alerts. Underneath the Actions column, the Advanced edit option can be clicked, exposing all the underlying savedsearches.conf configurable attributes.

The Advanced edit option is quite powerful as it exposes all possible attributes that can be configured within savedsearches.conf, even if those attributes are not currently configured when viewing the file directly.
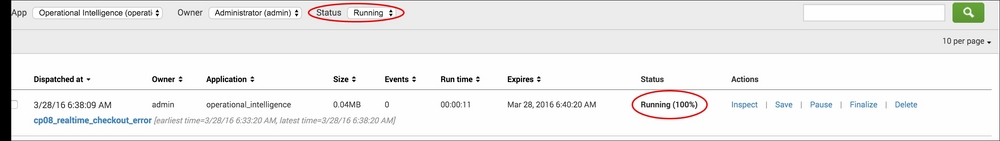
A quick and useful way to see what real-time searches are currently running on your Splunk environment is to leverage the Jobs screen. From the main menu at the top right-hand side, click on the Activity dropdown and select Jobs.

The Jobs screen will load. Select Running to view all the running jobs in the Operational Intelligence application. You will note that the cp08_realtime_checkout_error search is displayed and the Status column is set to Running (100%). All real-time searches in Splunk will be displayed with a Running (100%) status, and this is a quick way of identifying them. Historical searches will increment up to 100 percent as they progress and then disappear out of the running jobs once 100 percent is reached and the search finalized. However, real-time searches will stay at 100 percent forever until they are disabled or deleted. If a restart of Splunk is performed, all real-time searches will restart automatically when Splunk comes back up.