
Now that we have built a couple of data models, we can begin using Splunk's Pivot tool to search and report the data without needing to write any searches.
In this recipe, you will start to get familiarized with the Pivot interface and use it to calculate total sales transaction data. You will focus on identifying successful checkout transactions. These are important from an intelligence standpoint, as they indicate that a sale has occurred and payment has been made successfully. This data will then be populated on the Product Monitoring dashboard. You will be using the transaction data model object that we defined in the Application data model.
To step through this recipe, you will need a running Splunk Enterprise server, with the sample data loaded from Chapter 1, Play Time – Getting Data In, and the completed recipes from earlier in this chapter. You should be familiar with navigating the Splunk user interface.
Follow these steps in this recipe to pivot the total sales transactions:
- Log in to your Splunk server.
- Select the Operational Intelligence application.
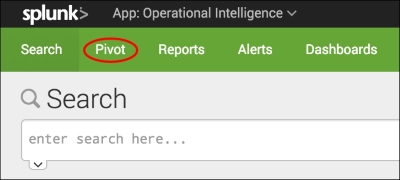
- Select the Pivot menu item from the application menu.
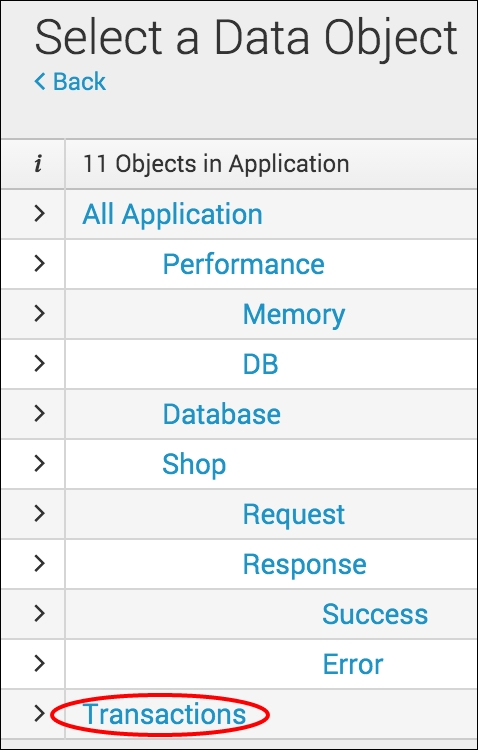
- Now select the Application data model, and then select the Transactions object.
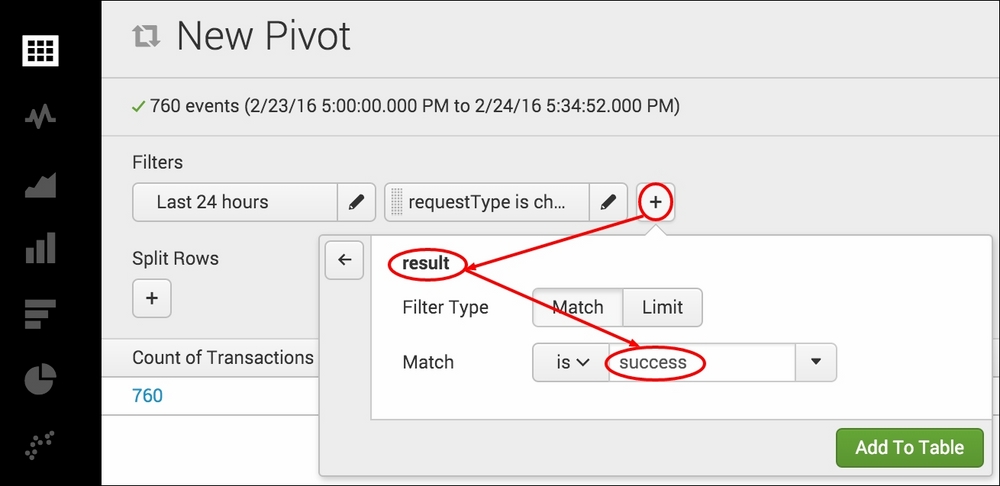
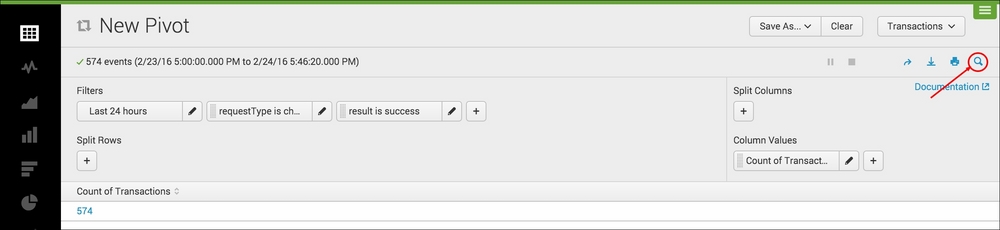
- The New Pivot screen will load. Under the Filters section, change the time range to Last 24 hours. Next, select the + sign to add a new filter and select requestType from the list of available attributes. Then select to match requestType of checkout. Once complete, click on the Add to Table button to add this new filter to the Pivot.

- Add another filter where result matches success.
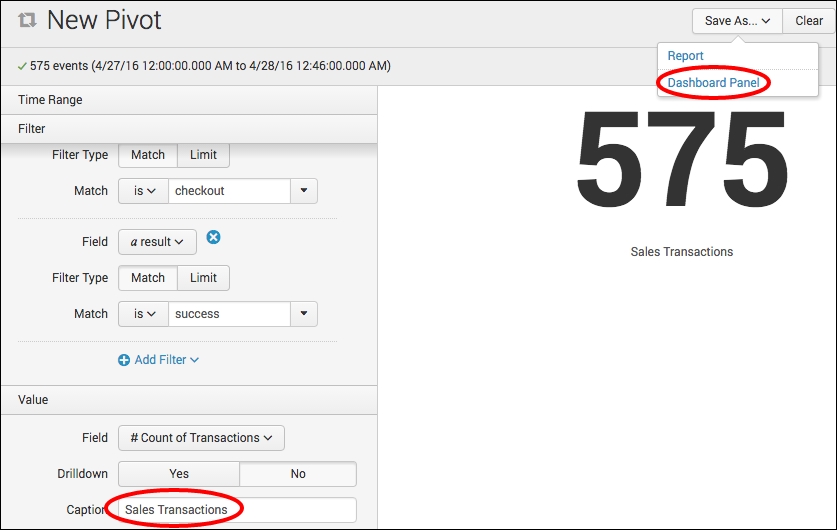
- You should see the total count of transactions displayed. To turn this into a single value visualization, select the Single Value Display icon on the left-hand side of the screen.

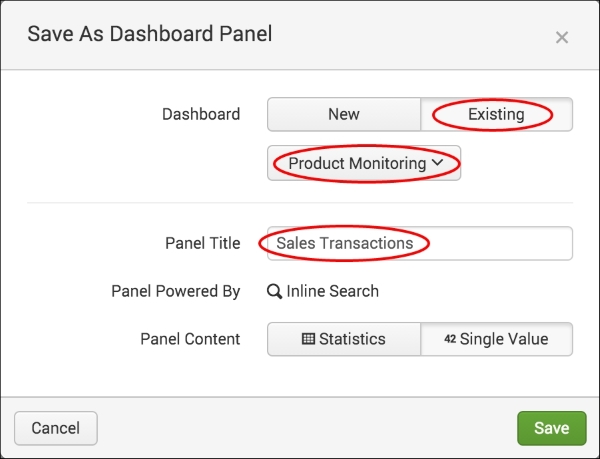
- Locate the Caption textbox on the left-hand side and enter a value of Sales Transactions. You should see this appear under the number of transactions. Then click on Save As and select Dashboard Panel.
- Select Existing in the Dashboard field and ensure Product Monitoring is selected. Enter Sales Transactions in the Panel Title field and click on Save.
- The single value is added to the dashboard and this recipe is complete.
The Pivot tool allows for datasets defined in data models to be searched without the need to enter any searches into Splunk. In this recipe, you leveraged the transaction data model object, created in a previous recipe, which brings together all the application requests and associated responses. You applied filters to the dataset to identify the successful checkout transactions. Splunk then subsequently displayed the count of transactions that matched the specified filter over the selected time range and you chose to display this as a single value visualization and add it to the Product Monitoring dashboard. Behind the scenes, Splunk uses the defined object and object attributes, together with the Attribute filters, to create a Splunk search, not too different from a | stats count type search. Splunk is then able to visualize the data in a similar way to how you visualized data from a search. When adding to the existing dashboard, Splunk identifies the inline search associated with it as a Pivot search.
The Pivot tool provides users with a great point and click method for reporting and visualizing datasets, without having to get to grips with the Splunk search language. However, it is also possible to view the pivoted data using the Splunk search interface.
The Splunk pivot command allows Pivot-based searching of datasets mapped by data models directly from the Splunk search interface. The command differs from the datamodel command we looked at earlier in this chapter, as it can take advantage of performance gains offered by accelerated data models, whereas datamodel cannot. However, the datamodel command is more extensible, as it allows regular Splunk search syntax following the command, whereas Pivot uses a specialized search syntax that is slightly different from the regular Splunk search syntax.
When you use the Pivot tool interface to manipulate the underlying dataset, Splunk writes a search using the pivot command behind the scenes. Once you have filtered and split the data to report on as needed, you can select to Open in Search by clicking on the little magnifying glass in the top-right corner of the Pivot interface.
For this recipe, you will note that the Pivot search resembles something along the lines of the following search:
| pivot Application Transactions count(Transactions) AS "Count of Transactions" FILTER requestType is checkout FILTER result is success ROWSUMMARY 0 COLSUMMARY 0 NUMCOLS 0 SHOWOTHER 1
As can be seen, this is a slightly different search syntax from the regular Splunk SPL that we have covered so far. Much like the datamodel command, the pivot command must be the first command of the search and followed by the name of the data model (Application) and then the name of the object (Transactions). Following this, you must also provide a transforming function, such as count. However, given this specialized syntax, it is easier to use the Pivot tool to filter the data as needed to create the underlying Pivot search than it is to write the search yourself.
Note
For more information on the pivot command, you should review the search reference at http://docs.splunk.com/Documentation/Splunk/latest/SearchReference/Pivot.