No one likes to wait for a web page to load, and we certainly do not want users of our web application waiting either! Within our web access logs, there is a field named response that tracks the total time the page has taken to load in milliseconds.
In this recipe, we will track the average page load time over the past week at different times of the day.
To step through this recipe, you will need a running Splunk Enterprise server, with the sample data loaded from Chapter 1, Play Time – Getting Data In. You should be familiar with the Splunk search bar and the time range picker.
Follow the given steps to search and calculate the web page response time statistics over the past week:
- Log in to your Splunk server.
- Select the Search & Reporting application.
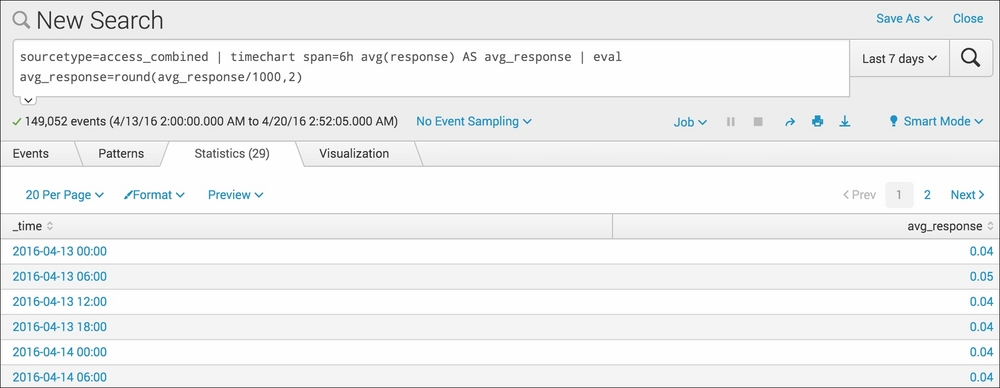
- Ensure that the time range picker is set to Last 7 days and type the following search into the Splunk search bar. Then, click on Search or hit Enter.
sourcetype=access_combined | timechart span=6h avg(response) AS avg_response | eval avg_response=round(avg_response/1000,2)
- Splunk will return a tabulated list, detailing the average response time for every 6-hour period, going back a week.
- This is great, but hard to visualize in a tabular form. Click on the Visualization tab and you will see this data represented as a chart.
- Click on the chart type link in the upper-left of the chart (next to the Format link) and select Line if not already selected. Splunk now presents this data in a nice line chart, and we can now see the average response time at different times of the day much more clearly.

- Save this search by clicking on Save As and then on Report. Give the report the name
cp02_webpage_response_timesand click on Save. On the next screen, click on Continue Editing to return to the search.
Let's break down the search piece by piece:
|
Search fragment |
Description |
|---|---|
|
|
You should now be familiar with this search from the earlier recipes in this chapter. |
|
|
Using the |
|
|
Using the |
The timechart command offers some great functionality. Searches like this can be extended further to graphically compare several weeks against one another to spot anomalies and other issues.
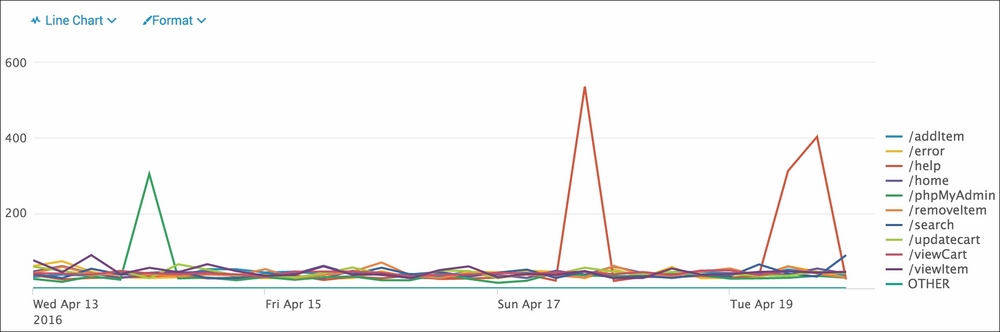
We can further amend the search to offer granular information on average response time by the type of action being performed. This might pinpoint some actions that are less responsive than the others. For example, we might want to ensure that the checkout page remains at an optimal load time. For the following search to work, you must complete the Defining field extractions recipe in Chapter 1, Play Time – Getting Data In, to extract the response field:
sourcetype=access_combined uri_path=* | timechart span=6h avg(response) by uri_path | foreach * [eval <<FIELD>>=round(<<FIELD>>/1000,2)]
We are now searching for web page events and then we will calculate the average time by page (uri_field). This results in a table of multiple columns, where each column represents a different web page. When we visualize this on a line graph, we now see many different lines on the same chart—pretty cool! You will notice that we used a pretty advanced Splunk search command, earlier named foreach. This is essentially a for type loop that cycles through each of the column fields in the table and applies a calculation to convert the average time by page from milliseconds to seconds while rounding the value to two decimal places: