
The identification of abnormalities within events can prove to be valuable for many reasons: it can lead to the identification of a resource issue, highlight malicious activities hidden within high volumes of events, or simply detect the users attempting to interact with the application in a way they were not designed to. When building an Operational Intelligence application for your website, the ability to detect abnormal activities should be at the top of your list. Frequently, after issues are identified, remediated, and due diligence has been done, it is common to see that some abnormality in the system or application was an early identifier of the cause. Capitalize on these opportunities to capture the abnormalities and triage them accordingly.
In this recipe, you will create a Splunk search to highlight abnormal web requests based on the size of the request over a given time period. You will then present all findings in a tabular format.
To step through this recipe, you will need a running Splunk Enterprise server, with the sample data loaded from Chapter 1, Play Time – Getting Data In. You should have also completed the earlier recipes in this chapter and be familiar with navigating the Splunk user interface.
Follow the steps in this recipe to identify abnormally-sized web requests:
- Log in to your Splunk server.
- Select the Operational Intelligence application.
- Ensure the time range picker is set to Last 24 hours and type the following search into the Splunk search bar. Then, click on the search button or hit Enter.
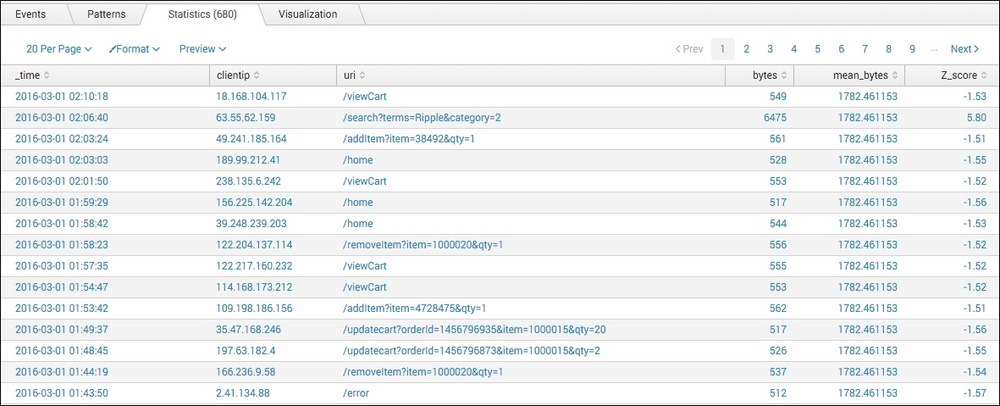
index=main sourcetype=access_combined | eventstats mean(bytes) AS mean_bytes, stdev(bytes) AS stdev_bytes | eval Z_score=round(((bytes-mean_bytes)/stdev_bytes),2) | where Z_score>1.5 OR Z_score<-1.5 | table _time, clientip, uri, bytes, mean_bytes, Z_score
- Splunk will return the results in a tabulated form, similar to the following example:
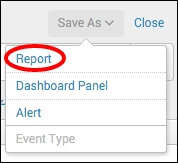
- Let's save this search as a report. Click on Save As and choose Report from the drop-down menu.
- In the Save As Report pop-up box that appears, enter
cp06_abnormal_web_request_sizeas the title and then click on Save.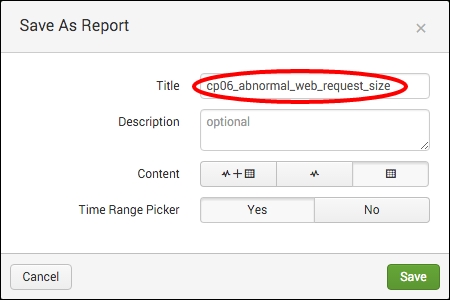
- You will receive a confirmation that your report has been created. Now, let's add this report to the Session Monitoring dashboard you created earlier in this chapter. In the next window, click on Add to Dashboard.

- In the Save As Dashboard Panel pop-up box, click on the Existing button beside the Dashboard label, and then select Session Monitoring from the drop-down menu. Enter
Abnormal Web Requests by Sizein the Panel Title field and ensure it is powered by Report. Then, click on Save.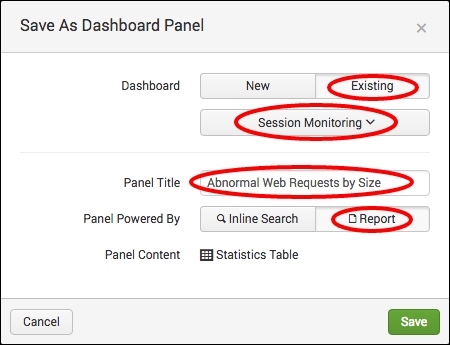
- You can now click on View Dashboard to see your newly added panel.
Let's break down the search piece by piece:
|
Search fragment |
Description |
|---|---|
|
|
You should now be familiar with this search from the earlier recipes. It is used to return events from the website access log. |
|
|
The |
|
|
Using the |
|
|
Using the |
|
|
The |
In this recipe, we looked at the use of the eventstats command with some general statistics applied to isolate events that might deviate too far from what is considered normal. There are a few other prebuilt commands that Splunk has to perform similar tasks. We will cover these commands in the following sections.
The anomalies command is used to look for events based on the values of a field and return only those values that you won't expect to find. As the anomalies command is run, it assigns an unexpectedness score to each event, and the event is only considered unexpected if the unexpectedness score breaches the defined threshold. In the following example, we use the anomalies command to assess the bytes field within our website access logs, and we define a threshold of unexpectedness at 0.03. The table and sort commands are just to make the data presentation a little bit nicer.
index=main sourcetype=access_combined | anomalies field=bytes threshold=0.03 | table unexpectedness, _raw | sort –unexpectedness
The results that are returned will be those that the anomalies command deems to be unexpected events. The algorithm that scores the events is proprietary to Splunk, but a short description can be found on the Splunk documentation site for the anomalies command.
Note
For more information on the anomalies command, visit http://docs.splunk.com/Documentation/Splunk/latest/SearchReference/Anomalies.
The
anomalousvalues command provides yet another means to find irregular or uncommon search results. It looks at the entire event set for the given time range, takes into consideration the distribution of values, and then makes a decision on whether a value is anomalous. In the following example, we use the anomalousvalues command against the website access logs and set a probability threshold of 0.03 that must be met:
index=main sourcetype=access_combined | anomalousvalue pthresh=0.03
The results that are returned will be those that the anomalousvalues command deems to be anomalous.
Note
For more information on the anomalousvalues command, visit http://docs.splunk.com/Documentation/Splunk/latest/SearchReference/Anomalousvalue.
The
anomalydetection command provides yet another means to find irregular or uncommon search results. It identifies anomalous events by computing a probability for each event and then detecting unusually small probabilities. The probability is defined as the product of the frequencies of each individual field value in the event. In the following example, we use the anomalydetection command against the website access logs bytes field and set a probability threshold of 0.03 that must be met:
index=main sourcetype=access_combined | anomalydetection action=filter pthresh=0.03 bytes
The results that are returned will be those that the anomalydetection command deems to be anomalous.
The anomalydetection command includes the capabilities of existing anomalousvalue and outlier SPL commands and offers a histogram-based approach for detecting anomalies. This command was introduced in Splunk 6.3.
Note
For more information on the anomalydetection command, visit http://docs.splunk.com/Documentation/Splunk/latest/SearchReference/Anomalydetection.
The cluster command provides a method to cluster similar events together, making it easier for you to identify outliers. outliers are those events that are part of very small clusters or are on their own; all other events are a part of large-sized clusters. In the following example, we use the cluster command against the website access logs to identify any potential outlier. The showercount parameter is used to ensure the size of each cluster displayed. The table and sort commands are just to make the data presentation a little bit nicer.
index=main sourcetype=access_combined | cluster showcount=t | table cluster_count _raw | sort +cluster_count
The results that are returned will be sorted with the smallest cluster being listed first. Additional filtering, such as NOT status=200, can be applied to the event search to further filter out false-positives and allow for proper prioritization of event investigation.
Note
For more information on the cluster command, visit http://docs.splunk.com/Documentation/Splunk/latest/SearchReference/Cluster.