
When viewing a dashboard in Splunk, there is usually a very high probability that you will look at a chart or report and want to know more details about the information that you are looking at.
Splunk dashboards can be configured to let the user drill down into more details. By linking the results or data points to an underlying dashboard or report, information about what the user clicked on can provide them with the next level of detail or the next step in the process they are following.
This recipe will show you how you can configure reports to drill down into subsequent searches and other dashboards so that you can link them together into a workflow that gets the user to the data they are interested in seeing within your Operational Intelligence application.
To step through this recipe, you will need a running Splunk Enterprise server, with the sample data loaded from Chapter 1, Play Time – Getting Data In, and you should have completed the earlier recipes in this chapter. You should also be familiar with navigating the Splunk user interface.
Follow these steps to configure a dashboard report with row drilldown capabilities:
- Log in to your Splunk server.
- Select the Operational Intelligence application.
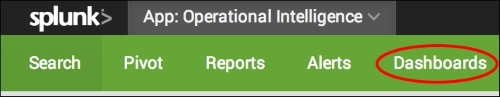
- Click on the Dashboards menu.
- Click on the Create New Dashboard button.

- Name the dashboard
Visitor Monitoringand set the Permissions field to Shared in App.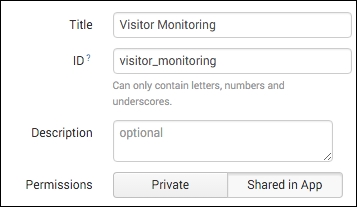
- Click on Create Dashboard.
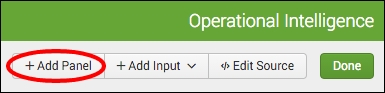
- When the empty dashboard is displayed, click on the Add Panel button.
- From the fly-out panel, expand the New section then click on Statistics Table.
- Set the Content Title panel to Session Listing.
- Set the Search String field to the following:
index=main sourcetype=access_combined | iplocation clientip | fillnull value="Unknown" City, Country, Region| replace "" with "Unknown" in City, Country, Region | stats count by JSESSIONID, clientip, City, Country, Region | fields clientip, City, Region, Country
- Set the time range to Last 24 hours.

- Click on the Add to Dashboard button.
- Click anywhere on the dashboard to make the fly-out panel disappear.
- Click on the panel edit icon, select the Row option for the Drilldown setting, and click anywhere on the page.

- Click on the Done button to finish editing the dashboard.

- Click on a row in the dashboard table, and Splunk will now drill down to the search screen and execute a search that is filtered by the
clientipvalue in the row you selected to drill down on.
The drilldown feature of dashboards can be utilized to get your users to the next set of data they need. When they click on a table entry or a part of a chart, they set off a search that can drill down into more details about the item they clicked on. The behavior of the drilldown is controlled by the configuration of the panel in the SimpleXML code but also has a few options displayed by the dashboard editor.
When displaying a table of results, there are three options that can be chosen from:
|
Option |
Description |
|---|---|
|
|
When a row is clicked on, the search that is launched by the drilldown is based on the x-axis value, which is the first column in the row. |
|
Cell |
When a particular cell is clicked on, the search that is launched by the drilldown is based on both the x-axis and y-axis values represented by that cell. |
|
None |
The drilldown functionality is disabled. When a user clicks on the table, the page will not change. |
When displaying a chart, there are two options for the drilldown behavior that can be chosen from:
|
Option |
Description |
|---|---|
|
On |
When a row is clicked on, the search that is launched by the drilldown is based on the values of the portion of that chart. |
|
Off |
The drilldown functionality is disabled. When a user clicks on the table, the page will not change. |
When the drilldown search is started after the table or chart is clicked on, it is generally derived by taking the original search, backing off the final transforming commands, and then adding the values that were selected, depending on the drilldown setting.
The drilldown options can be customized and provide many different options to control the behavior when dashboards are clicked on.
To disable the drilldown feature, you can specify the
None option in the Drilldown setting of the edit panel form or add/modify the following SimpleXML option to the panel source:
<option name="drilldown">none</option>
Tip
A full reference of drilldown options can be found in the Splunk documentation at http://docs.splunk.com/Documentation/Splunk/latest/Viz/PanelreferenceforSimplifiedXML#Panel_visualization_elements.