It is important that our web application remains responsive for users. Sites that lag frequently put off users and can result in them going elsewhere or lost sales. In Chapter 2, Diving into Data – Search and Report, you completed a recipe that analyzes average response times over a given period. In this recipe, you will create a scheduled alert to identify response times that are abnormal (that is, not within the normal range).
To step through this recipe, you will need a running Splunk Enterprise server, with the sample data loaded from Chapter 1, PlayTime – Getting Data In. You should be familiar with navigating the Splunk user interface. You should also have configured the e-mail settings on your Splunk to enable the delivery of e-mail alerts.
Note
Should you be running your Splunk server on a desktop PC for the purposes of this book and wondering how to configure the e-mail settings, there is a good Splunk blog posting on configuring Splunk to work with Gmail and Yahoo Mail at http://blogs.splunk.com/tag/gmail/.
Follow the steps in this recipe to create an alert that identifies abnormal response times:
- Log in to your Splunk server.
- Select the Operational Intelligence application.
- Ensure that the time range picker is set to Last 60 minutes and type the following search into the Splunk search bar. Then, click on the magnifying glass icon or hit Enter.
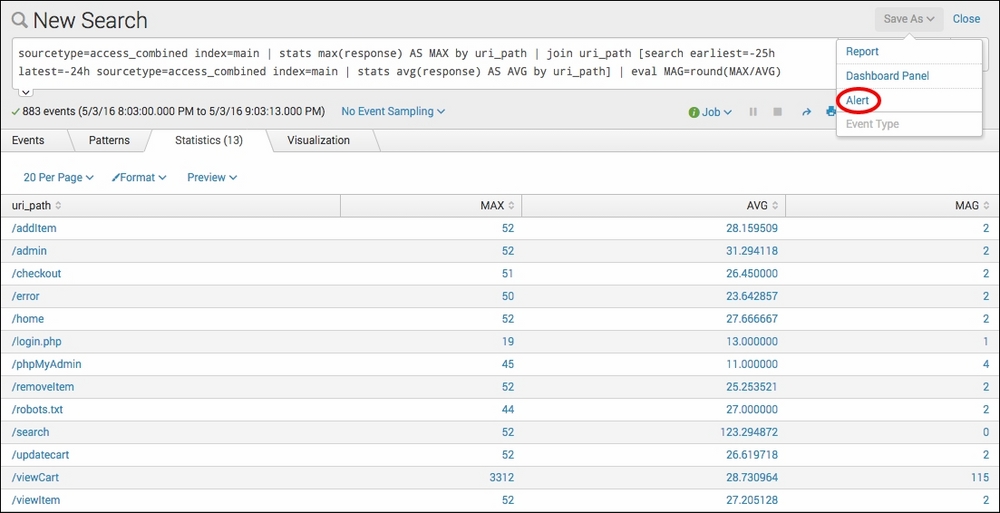
sourcetype=access_combined index=main | stats max(response) AS MAX by uri_path | join uri_path [search earliest=-25h latest=-24h sourcetype=access_combined index=main | stats avg(response) AS AVG by uri_path] | eval MAG=round(MAX/AVG)
- Once the search completes, you should see tabulated data. In the Save As dropdown, select Alert.
- A pop-up box will appear to provide the alert configuration options. Perform the following steps on this screen:
- Give the alert the Title
cp08_abnormal_webpage_response. - Select Shared in App as Permissions.
- Select Scheduled as Alert type, and select Run every hour from the dropdown below.
- Select Custom as the Trigger alert when value, and enter
search MAG>5in the textbox below that. Select Once as the Trigger.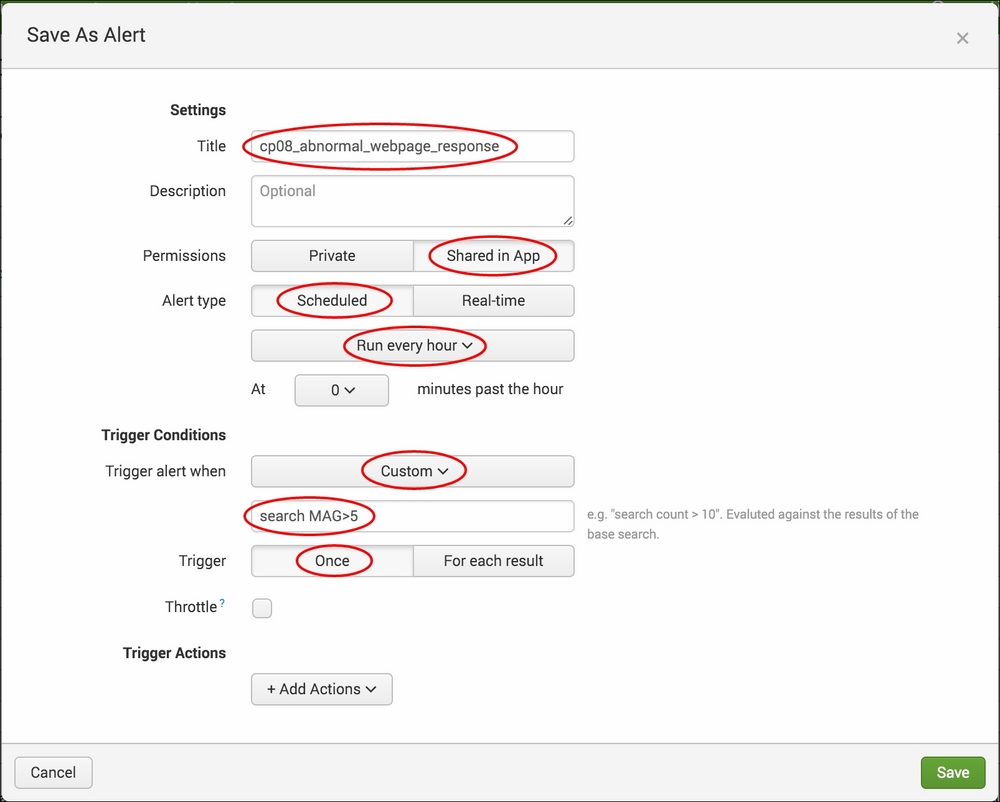
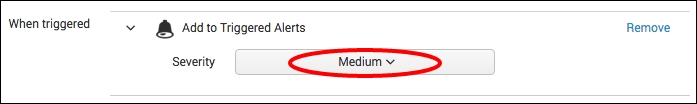
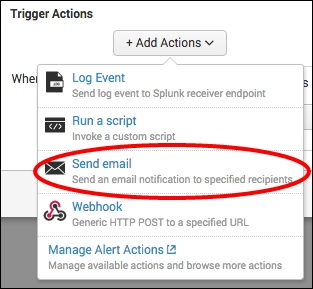
- Click on Add Actions. Select Add to Triggered Alerts from the Add Actions dropdown.

- From the Severity dropdown, select Medium.
- Click on Add Actions. Select Send email from the Add Actions dropdown.
- Enter a valid e-mail address in the To box; this is where the alert will go to.
- In the Include section, check Link to Alert, Link to Results, Trigger Condition, and Trigger Time.
- In the Type section, select HTML & Plain Text.

- Verify that the given details are entered correctly, and then click on Save.
- Give the alert the Title
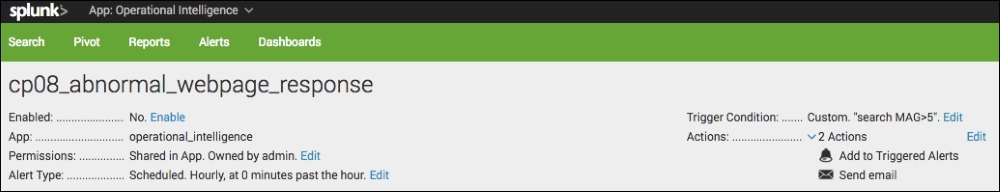
- Click on View Alert. A summary screen should be displayed. Your first alert is now configured and set to run every hour in accordance with the schedule. The alert should trigger but might take some time, depending on when you scheduled the alert:
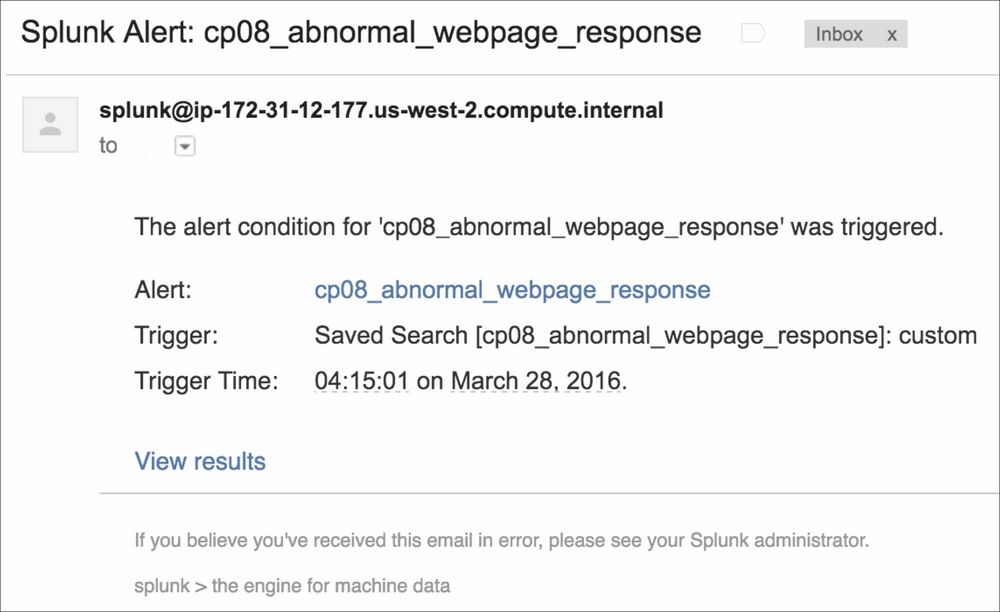
- When the alert triggers, you should receive an e-mail similar to the following screenshot. Note that the link to the alert, the link to the results, and the trigger condition in the body of the e-mail are as specified when configuring.
In this recipe, you created a search to look for abnormal web page response times by creating an alert to trigger when the maximum response time in the last hour for a given web page was five times greater than the average response time for that page at the same time yesterday.
We selected to get the average from the same period yesterday, as the data might be abnormal today. You might wish to look back over a wider period, such as 7 days, to get a more accurate average. Alternatively, you could have a hardcoded threshold for the number of milliseconds within which a web page must respond that you could use instead.
Let's break the search down piece by piece:
|
Search fragment |
Description |
|---|---|
index=main sourcetype=access_combined |
You should now be familiar with this search from the earlier recipes in this book. |
| stats max(response) AS MAX by uri_path |
Using the |
| join uri_path [search earliest=-24h latest=-23h sourcetype=access_combined index=main | stats avg(response) AS AVG by uri_path] |
Using the |
| eval MAG=round(MAX/AVG) |
Using the |
After writing the search, you saved it as an alert and gave it the custom condition of search MAG>5. This essentially means that if a response time is seen in the past hour that is greater than five times the average for that particular web page, trigger the alert. Behind the scenes, Splunk essentially adds this condition to the search string, and if any results are returned then the alert is triggered.
This alert used the scheduled alert type and is based on a historical search that runs periodically in accordance with the hourly schedule you set. In terms of alert actions, you selected to have an e-mail sent out each time the alert is triggered and also for the triggered alert to appear in the Alert manager inside Splunk.
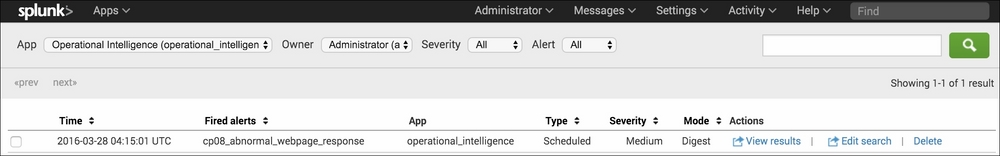
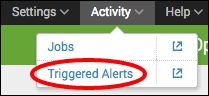
Assuming that an alert has been triggered, you can view the alert in the Alert manager by clicking on the Activity drop-down menu at the top right-hand side of the screen and selecting Triggered Alerts.
Once the screen has loaded, you will see all the alerts that have triggered to date. There are not too many management actions you can take on the triggered alerts, although you can delete them from the list or select to edit the underlying alert if any tweaks are needed. Clicking on View Results for any alert will pop open a new screen with the results of the underlying search that powers the alert. Basic filtering and search capability are also provided for the triggered alerts in the list.