
SharePoint 2010 includes two built-in mechanisms for capturing information about internal events and errors:
Event Logging SharePoint writes messages to the Application event log made available through the Event Viewer utility in the Windows operating system. The event log is primarily intended for administrators and support staff to understand what configuration and maintenance problems SharePoint reports.
Trace Logging SharePoint writes information into a set of log files stored in a specified directory. The trace log is primarily intended for developers and Microsoft support teams to identify internal errors and issues that often indicate more complex problems with the system.
Working with the Event Log
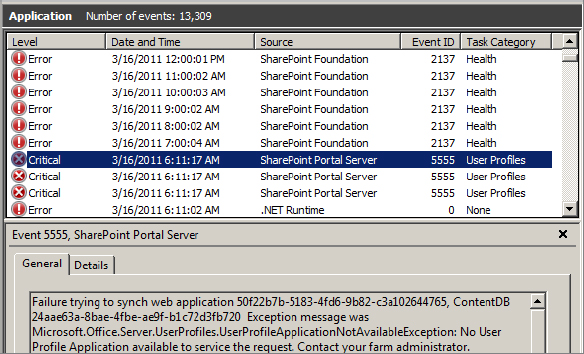
To access the SharePoint event log, log onto a SharePoint server and from the Start menu, select Administrative Tools; then click Event Viewer. SharePoint events are logged to the Application event log, as shown in Figure 15.12.
Figure 15.12: Application event log
The messages that appear in the event log will correspond to one of five levels, as shown in Table 15.3. These message levels also correspond to the logging levels that SharePoint can be set to output so that you can configure the log for greater or fewer messages. In general, the lower in the table that the level is listed, the more messages are likely to appear in the event log.
Table 15.3: Event log message levels
| Logging Level | Explanation |
| Critical | Indicates a serious problem resulting in the failure of a process. |
| Error | Indicates a significant problem that may be temporary or lead to permanent problems and should be tracked over time. |
| Warning | Indicates a potential problem that should be investigated for preventive maintenance. |
| Information | No issue has occurred but the information may be useful in diagnosing problems. |
| Verbose | Detailed informational messages that only appear when specifically enabled in SharePoint. |
Working with the Trace Log
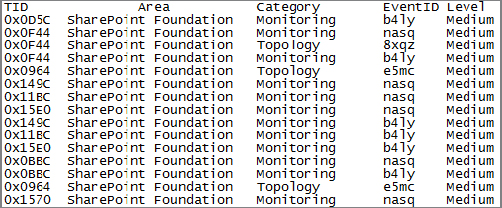
The trace log is also referred to as the ULS (Unified Logging Service) log. It generates files with more details than the event log. By default, these files are created in the C:Program FilesCommon FilesMicrosoft SharedWeb Server Extensions14LOGS directory, but the administrator can change this location if necessary. Files are given a name based on the pattern [SERVER NAME]-[DATE]-[TIME CREATED].LOG. For example, the file SPSERVER-20110217-4:17 p.m. log was created on February 17, 2011 at 2:17 p.m. Events are logged using the time zone of the server that the event was recorded by. Columns of data include Area (what part of SharePoint is involved), Category, and Level, as shown in Figure 15.13.
Figure 15.13: Trace log
The messages that appear in the trace log correspond to one of five levels, as shown in Table 15.4.
Table 15.4: Trace log message levels
| Logging level | Explanation |
| Unexpected (Critical) | A condition has caused a component to throw an exception and fail. Some messages, such as those logged by the Health Analyzer, will use the term Critical, which is equivalent to Unexpected. |
| Monitorable | A condition prevented an operation from completing but did not throw an unrecoverable exception. |
| High | A high-priority or high-risk operation occurred in SharePoint but did not generate an error. |
| Medium | Informational messages. |
| Verbose | Informational messages intended to provide additional details for developers to determine the internal processing of a component. |
One consideration is the size that these logs may grow to. While the trace logs in SharePoint 2010 have been optimized to be half the size as those in SharePoint 2007, they still grow based on the rate at which messages are entered into the logs. A new log file is created every 30 minutes and the default setting is to retain 14 days of logs (336 files). Files may be 5 to 10 MB in size. Under normal conditions, it is not unusual for the log files to consume 5 GB or more of disk space. However, log files could grow substantially if SharePoint encounters a recurring issue that logs large numbers of events. If SharePoint runs out of disk space on the drive storing the log files, it will stop the logging service and log a message in the event log.
Configuring Diagnostic Logging Settings
The settings for both the event log and the trace log are configured on the same screen. To configure these settings, do the following:
1. From SharePoint 2010 Central Administration, click Monitoring.
2. In the Reporting section, click Configure Diagnostic Logging.
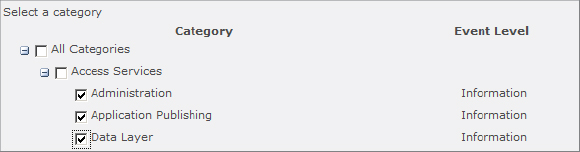
3. Use the Event Throttling portion of the page to define how detailed the log events should be. By reducing the number of events logged, the log files will be smaller but less information will be logged. When an issue requires greater detail, the logging level can be increased to output more events. Begin by selecting the specific categories of events that you want to see more detail on by checking the box next to each, as shown in Figure 15.14.
Figure 15.14: Event categories
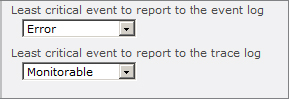
4. Underneath the categories of events, optionally make choices in the drop-downs labeled “Least critical event to report to the event log” and “Least critical event to report to the trace log,” as shown in Figure 15.15. To reset the logging levels back to the installed defaults, open the drop-down for the log you want to reset and select the Reset To Default option at the top of the list.
Figure 15.15: Logging level selection
5. Choosing Enable Event Log Flood Protection allows SharePoint to automatically detect when the same event is being logged repeatedly and to suppress the duplicate events. Enabling this option is the recommended setting.
6. In the Trace Log settings, shown in Figure 15.16, enter the path to the local directory where you want SharePoint to place the trace log files. We recommend that you specify a physical drive other than C: to minimize contention.
Figure 15.16: Trace Log settings
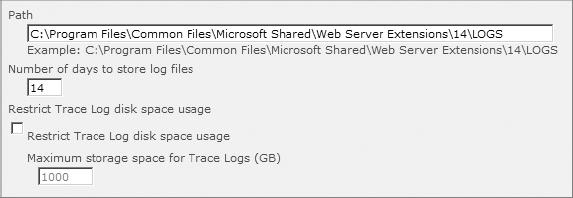
7. Specify the number of days to keep files for. SharePoint will automatically delete older files.
8. Optionally, you may choose to restrict the amount of disk space that SharePoint can use for trace logs to a specific number of gigabytes. Values can range from 1 GB to 1 TB.
9. Click OK.