Configure Web Analytics Reporting
The purpose of web usage analysis tools is to provide statistical information on the usage paterns of a web application. A primary benefit of this reporting is to determine the total utilization of SharePoint among the user base for growth and scalability projections. You can also use this information to identify possible issues or areas for improvement in the system by noting sites and pages with low traffic or search queries that return no results.
An important point about all these benefits is that they require a proactive and recurring schedule of monitoring to be effective. It is a good idea for each organization to have at least one IT staff member who is responsible for periodically viewing the usage reports and looking for trends or patterns that should be considered.
Configuring Web Analytics
In SharePoint 2010, usage analysis data is enabled by the Web Analytics service application, which runs as a shared service. The configuration of the Web Analytics service is discussed in Chapter 4, “Creating Service Applications.” Once the service application is created, ensure that the Web Analytics Web Service and Web Analytics Data Processing Service are started on each WFE server. These services can be viewed in Central Administration on the Services On Server page.
Once the services are running, you need to enable usage data collection and configure the data to be logged. Do the following:
1. From SharePoint 2010 Central Administration, click Monitoring.
2. In the Reporting section, click Configure Usage And Health Data Collection.
3. In the Usage Data Collection section, click the Enable Usage Data Collection check box.
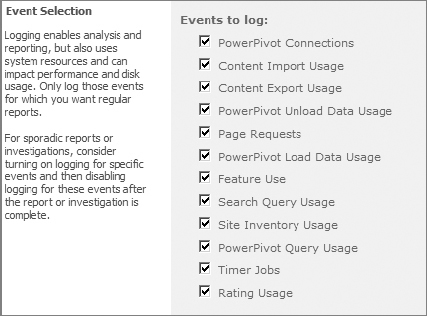
4. In the Event Selection section, shown in Figure 15.3, check the boxes for types of events you want to log. Generally, all events are logged for usage analysis; however, this does add overhead to the server and takes up more log space on the disk, so you may choose to not log specific events.
Figure 15.3: Choosing events to log
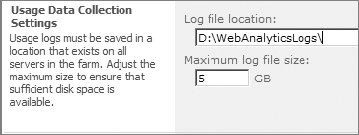
5. In the Usage Data Collection Settings section, shown in Figure 15.4, specify the physical directory where the usage log files will be stored. The log files contain the usage data collected in binary format. Ensure that you select a directory on a drive with sufficient free disk space. To ensure that disk usage does not grow uncontrollably, you can specify a maximum size for usage log files. When the limit is reached, SharePoint will delete older logs to make room.
Figure 15.4: Usage Data Collection Settings section
6. The processing of log files and generating of analyzed results is handled by two timer jobs. Both jobs run every 30 minutes by default. To change the schedule for the timer jobs, click the Log Collection Schedule link, and then click each job to edit the schedule.
The timer jobs are:
Microsoft SharePoint Foundation Usage Data Import Job Collects the log files and stores the data in the web analytics database
Microsoft SharePoint Foundation Usage Data Processing Job Compiles the raw data into summarized results
7. Click OK.
Viewing Analytics Reports
SharePoint 2010 offers three categories of web analytics reports: Traffic, Search, and Inventory. The reports are generated and viewable at different scopes within SharePoint, including the site level, the site collection level, the web application level, and specialized reports for the search service. Most reports show a default data view of 30 days and can be adjusted to show up to 25 months of data.
Viewing Site Collection Reports
To view site collection reports:
1. Navigate to the home page at the root of a site collection for which you are the site collection administrator.
2. Select Site Actions, then Site Settings.
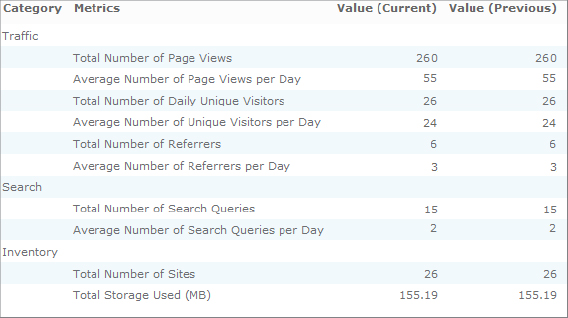
3. In the Site Actions section, click Site Collection Web Analytics Reports. The Summary page is displayed as shown in Figure 15.5. This page displays overall statistics for the site collection both in total and averaged per day.
Figure 15.5: Site Collection Web Analytics – Summary page
Viewing Site Reports
To view site reports:
1. Navigate to the home page at the site for which you are the site owner.
2. Select Site Actions, then Site Settings.
3. In the Site Actions section, click Site Web Analytics Reports. The Summary page is displayed. (The Summary page for site reports is very similar to the Summary page for site collection reports, shown in Figure 15.5.)
To view web application reports:
1. From SharePoint 2010 Central Administration, click Monitoring.
2. In the Reporting section, click View Web Analytics Reports. The Web Analytics Reports – Summary page is displayed showing Total Number Of Page Views, Total Number Of Daily Unique Visitors, and Total Number Of Search Queries.
3. Click the link for the web application that you want to see details on. The Summary page for the web application is displayed showing aggregate values very similar to those shown in Figure 15.5.
Understanding Reports
Reports are generally presented in one of two forms:
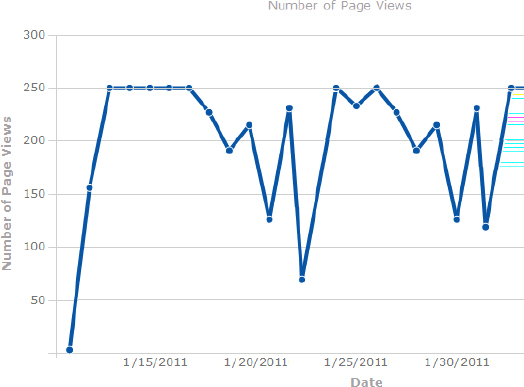
Trend Report A trend report displays how a specific measurement changes over time. It is typically shown as a line chart. (See the Number Of Page Views report in Figure 15.6.)
Figure 15.6: Number Of Page Views report
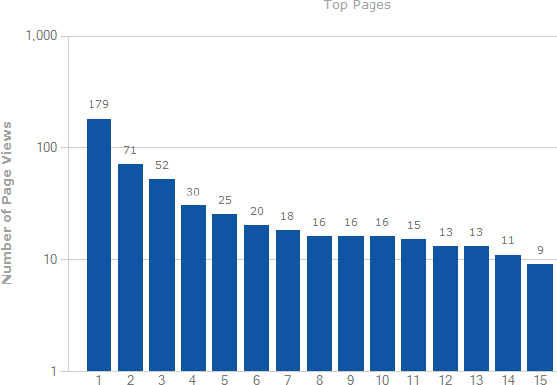
Rank Report A rank report shows a comparison of the top 2,000 results for a specific measure relative to each other. It is typically presented as a bar graph. (See the Top Pages report in Figure 15.7.)
Figure 15.7: Top Pages report
To change the date range for a report, click the Change Settings link at the top of the report and select a date range for the report.
There are three categories of reports available from the web analytics summary page: Search, Traffic, and Inventory.
Search reports are used to better understand the types of queries that users are making within the site collection in order to tune searches to provide better responses. Search reports are covered in detail in Chapter 9, “Configuring Search Scopes and Search Results.”
The traffic reports show aggregated data on the number of visitors and page views in the site collection. Here is a brief description of each report:
First, trend reports:
Number Of Page Views Page visits per day.
Number Of Daily Unique Visitors Unique visitors per day. Anonymous visitors are identified by IP address.
Number Of Referrers Unique referrer websites per day. A referrer is a website that a user navigated from to get to this site.
Next, rank reports:
Top Pages Most popular pages during the specified period of time
Top Visitors Most frequent visitors during a period of time
Top Referrers Sites that referred users to this site the most often
Top Destinations Sites that users most often navigated to by clicking a link on this site
Top Browsers Most popular web browsers used by visitors
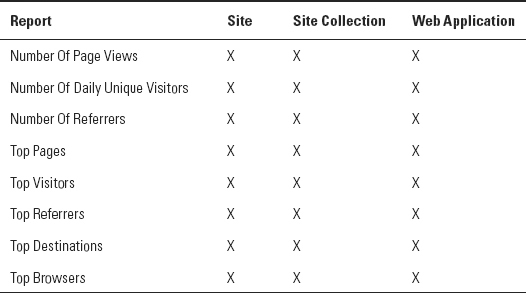
Table 15.1 shows which traffic reports are available at each scope in SharePoint.
Table 15.1: SharePoint traffic reports by scope
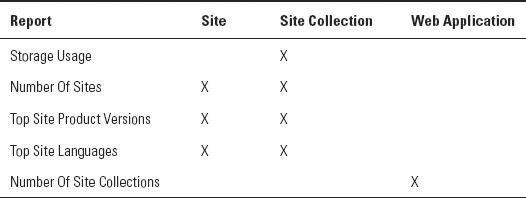
Inventory reports show sum totals for usage, number of sites, and top site statistics. The following inventory reports are available.
For trend reports:
Storage Usage Total space used in megabytes (MB) and the maximum limit set by quota for the site collection per day
Number Of Sites Total number of sites existing in the site collection per day
Number Of Site Collections Total number of site collections existing in the web application per day
For rank reports:
Top Site Product Versions For SharePoint farms that have been upgraded from a previous version, this report shows how many sites are using which version of the product.
Top Site Languages Languages most commonly assigned to sites in the site collection.
Table 15.2 shows which inventory reports are available at each scope in SharePoint.
Table 15.2: SharePoint inventory reports by scope