DOUGLAS J. LUCAS
Executive Director and Head of CDO Research, UBS
LAURIE S. GOODMAN, PhD
Co-head of Global Fixed Income Research Manager of U.S. Securitized Products Research, UBS
FRANK J. FABOZZ1, PhD, CFA, CPA
Professor in the Practice of Finance, Yale School of Management
Abstract A collateralized debt obligation (CDO) is an asset-backed security backed by a diversified pool of one or more classes of debt (corporate loans, corporate bonds, emerging market bonds, asset-backed securities, residential mortgage-backed securities, commercial mortgage-backed, securities, and real estate investment trusts). The list of asset types included in a CDO portfolio is continually expanding. CDOs are categorized based on the motivation of the sponsor of the transaction: balance sheet, arbitrage, or origination. A synthetic CDO is so named because the CDO does not actually own the pool of assets on which it has the risk. Stated differently, a synthetic CDO absorbs the economic risks, but not the legal ownership, of its reference credit exposures. The nonsynthetic CDO is referred to as a "cash" structure. The building block for synthetic CDOs is a credit default swap, which allows the transfer of the economic risk of a pool of assets, but not the legal ownership, of underlying assets.
Keywords: collateralized debt obligations (CDOs), synthetic CDOs, arbitrage CDOs, balance sheet CDOs, origination CDOs, market value credit structures, cash flow credit structure, cash flow waterfall, coverage tests, overcollateralization tests, Interest coverage tests, par value test, overcollateralization trigger, pay-in-kind (PIK) feature, quality tests, diversity score, weighted average rating factor (WARF) recovery rates, diversification, loss distribution tests, full capital structure CDOs, single-tranche CDOs, standard tranches of credit default swap indices
In this chapter we provide the basics of collateralized debt obligations (CDOs). We begin with an overview of cash CDOs. Then, we delve into more cash CDO details, including the cash flow credit structure, credit rating agencies' methodologies, interest rate hedging, and CDO call features. Finally, we discuss synthetic CDOs.
A CDO issues debt and equity and uses the money it raises to invest in a portfolio of financial assets such as corporate loans or mortgage-backed securities. It distributes the cash flows from its asset portfolio to the holders of its various liabilities in prescribed ways that take into account the relative seniority of those liabilities. This is just a starting definition; we will fill in the details of this definition over the next few pages.
Any CDO can be well described by focusing on its four important attributes: assets, liabilities, purposes, and credit structures. Like any company, a CDO has assets. With a CDO, these are financial assets such as corporate loans or mortgage-backed securities. And like any company, a CDO has liabilities. With a CDO, these run the gamut of preferred shares to AAA-rated senior debt. Beyond the seniority and subordination of CDO liabilities, CDOs have additional structural credit protections, which fall into the category of either cash flow or market value protections. Finally, every CDO has a purpose that it was created to fulfill, and these fall into the categories of arbitrage, balance sheet, or origination. In this section, we are going to look at the different types of assets CDOs hold, the different types of liabilities CDOs issue, the purposes for which CDOs are created, and the different credit structures CDOs employ.
Assets
CDOs own financial assets such as corporate loans or mortgage-backed securities. A CDO is primarily identified by its underlying assets.
Created in 1987, the first CDOs owned high-yield bond portfolios. In fact, before the term "CDO" was invented to encompass an ever-broadening array of assets, the term in use was "collateralized bond obligation" or "CBO." In 1989, corporate loans and real estate loans were used in CDOs for the first time, causing the term "collateralized loan obligation" or "CLO" to be coined. Generally, CLOs are comprised of performing high-yield loans, but a few CLOs, even as far back as 1988, targeted distressed and nonperforming loans. Some CLOs comprised of investment-grade loans have also been issued.
Loans and bonds issued by emerging market corporations and sovereign governments were first used as CDO collateral in 1994, thus "emerging-market CDO" or "EM CDO." In 1995, CDOs comprised of residential mortgage-backed securities (RMBS) were first issued. CDOs comprised of commercial mortgage-backed securities (CMBSs) and asset-backed securities (ABSs), or combinations of RMBS, CMBS, and, ABS followed, but they have never found a universally accepted name. We refer to them as a "structured finance CDO" or "SF CDO." However, Moody's champions the term "resecuritizations" and many others use "ABS CDO," even to refer to CDOs with CMBS and RMBS in their collateral portfolios.
Liabilities
Any company that has assets also has liabilities. In the case of a CDO, these liabilities have a detailed and strict ranking of seniority, going up the CDO's capital structure as equity or preferred shares, subordinated debt, mezzanine debt, and senior debt. These tranches of notes and equity are commonly labeled Class A, Class B, Class C, and so forth, going from top to bottom of the capital structure. They range from the most secured AAA-rated tranche with the greatest amount of subordination beneath it, to the most levered, unrated equity tranche. Table 38.1 shows a simplified tranche structure for a CLO.
Special purposes entities like CDOs are said to be "bankrupt remote." One aspect of the term is that they are new entities without previous business activities. They therefore cannot have any legal liability for sins of the past. Another aspect of their "remoteness from bankruptcy" is that the CDO will not be caught up in the bankruptcy of any other entity, such as the manager of the CDO's assets, or a party that sold assets to the CDO, or the banker that structured the CDO.
Another very important aspect of a CDO's bankruptcy remoteness is the absolute seniority and subordination of the CDO's debt tranches to one another. Even if it is a certainty that some holders of the CDO's debt will not receive their full principal and interest, cash flows from the CDO's assets are still distributed according to the original game plan dictated by seniority. The CDO cannot go into bankruptcy, either voluntarily or through the action of an aggrieved creditor. In fact, the need for bankruptcy is obviated because the distribution of the CDO's cash flows, even if the CDO is insolvent, has already been determined in detail at the origination of the CDO.
Within the stipulation, of strict seniority, there is great variety in the features of CDO debt tranches. The driving force for CDO structurers is to raise funds at the lowest possible cost. This is done so that the CDO's equity holder, who is at the bottom of the chain of seniority, can get the most residual cash flow.
Most CDO debt is floating rate off LIBOR (London Interbank Offered Rate), but sometimes a fixed rate tranche is structured. Avoiding an asset liability mismatch is one reason why floating rate, high-yield loans are more popular in CDOs than fixed rate, high-yield bonds. Sometimes a CDO employs short-term debt in its capital structure. When such debt is employed, the CDO must have a standby liquidity provider, ready to purchase the CDO's short-term debt should it fail to be resold or roll in the market. A CDO will only issue short-term debt if its cost, plus that of the liquidity provider's fee, is less than the cost of long-term debt.
Table 38.1. Simple, Typical CLO Tranche Structure
Tranche | Percent of Capital Structure | Rating | Coupon |
|---|---|---|---|
Class A | 77.5 | AAA | LIBOR + 26 |
Class B | 9 | A | LIBOR + 75 |
Class C | 2.75 | BBB | LIBOR + 180 |
Class D | 2.75 | BB | LIBOR + 475 |
Preferred shares | 8 | NR | Residual cash flow |
Sometimes a financial guaranty insurer will wrap a CDO tranche. Usually this involves a AAA-rated insurer and the most senior CDO tranche. Again, a CDO would employ insurance if the cost of the tranche's insured coupon plus the cost of the insurance premium is less than the coupon the tranche would have to pay in the absence of insurance. To meet the needs of particular investors, sometimes the AAA tranche is divided into senior AAA and junior AAA tranches.
Some CDOs do not have all their assets in place when their liabilities are sold. Rather than receive cash that the CDO is not ready to invest, tranches might have a delay draw feature, where the CDO can call for funding within some specified time period. This eliminates the negative carry that the CDO would bear if it had to hold uninvested debt proceeds in cash. An. extreme form of funding flexibility is a revolving tranche, where the CDO can call for funds and return funds as its needs dictate.
Purposes
CDOs are created for one of three purposes:
- Balance sheet.
A holder of CDO-able assets desires to (1) its balance sheet, (2) reduce required regulatory capital, (3) reduce required economic capital, or (4) achieve cheaper funding costs. The holder of these assets sells them to the CDO. The classic example of this is a bank that has originated loans over months or years and now wants to remove them from its balance sheet. Unless the bank is very poorly rated, CDO debt would not be cheaper than the bank's own source of funds. But selling the loans to a CDO removes them from the bank's balance sheet and therefore lowers the bank's regulatory capital requirements. This is true even if market practice requires the bank to buy some of the equity of the newly created CDO.
- Arbitrage.
An asset manager wishes to gain assets under management and management fees. Investors wish to have the expertise of an asset manager. Assets are purchased in the marketplace from many different sellers and put into the CDO. CDOs are another means, along with mutual funds and hedge funds, for an asset management firm to provide its services to investors. The difference is that instead of all the investors sharing the fund's return in proportion to their investment, investor returns are also determined by the seniority of the CDO tranches they purchase.
- Origination.
Banks, insurance companies, and real estate investment trusts (REITs) wish to increase equity capital. Here the example is a large number of smaller-size banks issuing trust-preferred securities directly to the CDO simultaneous with the COO's issuance of its own liabilities. (Trust-preferred, securities are unsecured obligations that are generally ranked lowest in the order of repayment.) The bank capital notes would not be issued but for the creation of the CDO to purchase them.
Three purposes differentiate CDOs on the basis of how they acquire their assets and focus on the motivations of asset sellers, asset managers, and trust preferred securities issuers. From the point of view of CDO investors, however, all CDOs have a number of common purposes, which explain why many investors find CDO debt and equity attractive.
One purpose is the division and distribution of the risk of the CDO's assets to parties that have different risk appetites. Thus, a AAA investor can invest in speculative-grade assets on a loss-protected basis. Or a BB investor can invest in AAA assets on a levered basis.
For CDO equity investors, the CDO structure provides a leveraged return without some of the severe adverse consequences of borrowing via repo from a bank. CDO equity holders own stock in a company and are not liable for the losses of that company. Equity's exposure to the CDO asset portfolio is therefore capped at the cost of equity minus previous equity distributions. Instead of short-term bank financing, financing via the CDO is locked in for the long term at fixed spreads to LIBOR.
Credit Structures
Beyond the seniority and subordination of CDO liabilities, CDOs have additional structural credit protections, which fall into the category of either cash flow or market value protections.
The market value credit structure is less often used, but easier to explain, since it is analogous to an individual's margin account at a brokerage. Every asset in the CDO's portfolio has an advance rate limiting the amount that can be borrowed against that asset. Advance rates are necessarily less than 100% and vary according to the market value volatility of the asset. For example, the advance rate on a fixed rate B-rated bond would be far less than the advance rate on a floating rate AAA-rated bond, Both the rating and floating rate nature of the AAA bond indicate that its market value will fluctuate less than the B-rated bond. Therefore, the CDO can borrow more against it. The sum of advance rates times the market values of associated assets is the total amount the CDO can borrow.
The credit quality of a market value CDO derives from the ability of the CDO to liquidate its assets and repay debt tranches. Thus, the market value of the CDO's assets are generally measured every day, advance rates applied, and the permissible amount of debt calculated. If this comes out, for example, to $100 million, but the CDO has $110 million of debt, the CDO must do one of two things. It can sell a portion of its assets and repay a portion of its debt until the actual amount of debt is less than the permissible amount of debt. Or the CDO's equity holders can contribute more cash to the CDO. If no effective action is taken, the entire CDO portfolio is liquidated, all debt is repaid, and residual cash given to equity holders. The market value credit structure is analogous to an individual being faced with a collateral, call at his (or her) brokerage account. If he does not post additional collateral, his portfolio is at least partially liquidated.
The cashflow credit structure does not have market value tests. Instead, subordination is sized so that the after-default cash flow of assets is expected to cover debt tranche principal and interest with some degree of certainty. Obviously, the certainty that a AAA CLO tranche, with 23% subordination beneath it, will receive all its principal and interest is greater than the certainty a BB CLO tranche, with only 8% subordination beneath it, will receive all its principal and interest.
Most cash flow CDOs have overcollateralization and interest coverage tests. These tests determine whether collateral cash flow is distributed to equity and subordinate debt tranches or instead diverted to pay down senior debt tranche principal or used to purchase additional collateral assets. We will discuss these tests in detail later in this chapter, but their purpose is to provide additional credit enhancement to senior CDO debt tranches,
Table 38.2 shows the four CDO building blocks and a variety of options beneath each one. Any CDO can be well described by asking and answering the four questions implied by the exhibit:
What are its assets?
What are the attributes of its liabilities?
What is its purpose?
What is its credit structure?
This way of looking at CDOs encompasses all the different kinds of CDOs that have existed in the past and all the kinds of CDOs that are currently being produced. By adding "synthetic asset option" and "unfunded super senior" to the matrix, the matrix also encompasses synthetic CDOs, a type of CDO we discuss in detail later in this chapter.
A number of parties and institutions contribute to the creation of a CDO.
CDO Issuer and Coissuer
A CDO is a distinct legal entity, usually incorporated in the Cayman Islands. Its liabilities are called CDOs, so one might hear the seemingly circular phrase "the CDO issues CDOs." Offshore incorporation enables the CDO to more easily sell its obligations to United States and international investors and escape taxation at the corporate entity level. When a CDO is located outside the U.S., it will typically also have a Delaware coissuer. This entity has a passive role, but its existence in the structure allows CDO obligations-to be more easily sold to U.S. insurance companies.
Asset Manager (Collateral Manager)
Asset managers (or collateral managers) select the initial portfolio of an arbitrage CDO and manage it according to prescribed guidelines contained in the CDO's indenture. Sometimes an asset manager is used in a balance sheet CDO of distressed assets to handle their workout or sale. A variety of firms offer CDO asset management services including hedge fund managers, mutual fund managers, and firms that specialize exclusively in CDO management.
Asset Sellers
Asset sellers supply the portfolio for a balance sheet CDO and typically retain its equity. In cash CDOs, the assets involved are usually smaller-sized loans extended to smaller-sized borrowers. In the United States, these are called "middle market" loans and in Europe these are called "small and medium enterprise" (SME) loans.
Investment Bankers and Structurers
Investment bankers and structurers work with the asset manager or asset seller to bring the CDO to fruition. They set up corporate entities, shepherd the CDO through the debt rating process, place the CDO's debt and equity with investors, and handle other organizational details. A big part of this job involves structuring the CDO's liabilities: their size and ratings, the cash diversion features of the structure, and, of course, debt tranche coupons. To obtain the cheapest funding cost for the CDO, the structurer must know when to use short-term debt or insured debt or senior/junior AAA notes, to name just a few structural options. Another part of the structurer's job is to negotiate an acceptable set of eligible assets for the CDO. These tasks obviously involve working with and balancing the desires of the asset manager or seller, different debt and equity investors, and rating agencies.
Table 38.2. CDO Structural Matrix
Assets | Liabilities | Purpose | Credit Structure |
|---|---|---|---|
High-yield loans | Fixed/floating rate | Arbitrage | Cash flow |
High-grade structured finance | PIK/non-PIK | Balance sheet | Market value |
Mezzanine structured finance | Guaranteed/unenhanced | Origination | |
Capital notes | Short term/long term | ||
High-yield bonds | Delayed draw/revolving | ||
Emerging market debt | |||
Synthetic assets | Unfunded super senior |
Insurers/Guarantors
Monoline bond insurers or financial guarantors typically only guarantee the senior-most tranche in a CDO. Often, insurance is used when a CDO invests in newer asset types or is managed by a new CDO manager.
Rating Agencies
Rating agencies approve the legal and credit structure of the CDO, perform due diligence on the asset manager and the trustee, and rate the various seniorities of debt issued by the CDO. Usually two or three of the major rating agencies (Moody's, S&P, and Fitch) rate the CDO's debt. DBRS is a recent entrant in CDO ratings and A.M. Best has rated CDOs backed by insurance company trust preferred securities.
Trustees
Trustees hold the CDO's assets for the benefit of debt and equity holders, enforce the terms of the CDO indenture, monitor and report upon collateral performance, and disburse cash to debt and equity investors according to set rules. As such, their role also encompasses that of collateral custodian and CDO paying agent.
As explained earlier, arbitrage CDOs are categorized as either cash flow transactions or market value transactions. The objective of the asset manager in a cash flow transaction is to generate cash flow for CDO tranches without the active trading of collateral. Because the cash flows from the structure are designed to accomplish the objective for each tranche, restrictions are imposed on the asset manager. The asset manager is limited in his or her authority to buy and sell bonds. The conditions for disposing of issues held are specified and are usually driven by credit risk management. Also, in assembling the portfolio, the asset manager must meet certain requirements set forth by the rating agency or agencies that rate the deal.
In this section, we review cash flow transactions. Specifically, we look at the distribution of the cash flows, restrictions imposed on the asset manager to protect the note-holders, and the key factors considered by rating agencies in rating tranches of a cash flow transaction. We focus on establishing a basic understanding of cash flow CDO deals using examples. (For a discussion of deals based by other types of collateral, see Lucas, Goodman, and Fabozzi (2006).
In a cash flow transaction, the cash flows from income and principal are distributed according to rules set forth in the prospectus. The distribution of the cash flows is referred to as the "waterfall." We describe these rules below and will use a representative CDO to illustrate them.
The representative CDO deal we will use is a $300 million cash flow CDO with a "typical" cash flow structure. The deal consists of the following:
$260 million (87% of the deal) Aaa/AAA (Moody's/S&P) floating rate tranche.
$27 million ($17 million fixed rate + $10 million floating rate) Class B notes, rated A3 by Moody's.
$5 million (fixed rate) Class C notes, rated Ba2 by Moody's.
$8 million in equity (called "preference shares" in this deal).
The collateral for this deal consists primarily of investment-grade, CMBS, ABS, RETT, and RMBS; 90% of which must be rated at least "Baa3" by Moody's or BBB– by S&P. (At the time of purchase, the collateral corresponded, on average, to a Baa2 rating.) The asset manager is a well-respected money management firm.
Figure 38.1 illustrates the priority of interest distributions among different classes for our sample deal. Interest payments are allocated first to high priority deal expenses such as fees, taxes, and registration, as well as monies owed to the asset manager and hedge counterparties. After these are satisfied, investors are paid in a fairly straightforward manner, with the more senior bonds paid off first, followed by the subordinate bonds, and then the equity classes.
Note the important role in the waterfall played by what is referred to as the coverage tests. We explain these shortly.
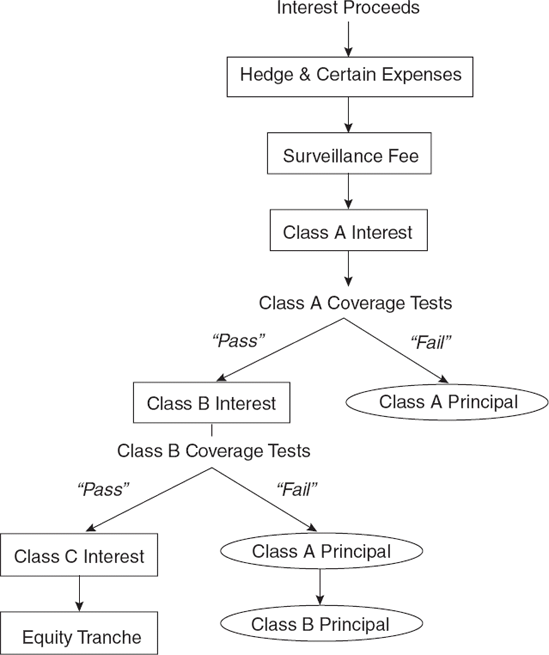
They are important because, before any payments are made on Class B or Class C bonds, coverage tests are run to assure the deal is performing within guidelines. If that is not the case, consequences to the equity holders are severe. Note from Table 38.1 if the Class A coverage tests are violated, then excess interest on the portfolio goes to pay down principal on the Class A notes, and cash flows will be diverted from all other classes to do so. If the portfolio violates the Class B coverage tests, then interest will be diverted from Class C and the equity tranche to pay down first principal on Class A, or, if Class A is retired, Class B principal.
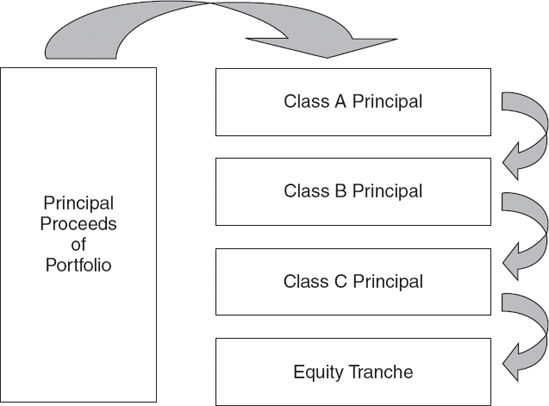
Figure 38.2 shows the simple principal cash flows for this deal. Principal is paid down purely in class order. Any remaining collateral principal from overcollateralization gets passed on to the equity piece.
Noteholders have two major protections provided in the form of tests. They are coverage tests and quality tests. We discuss each type in this section.
Coverage Tests
Coverage tests are designed to protect noteholders against a deterioration of the existing portfolio. There are actually two categories of tests—overcollateralization tests and interest coverage tests.
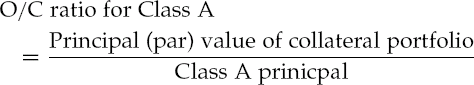
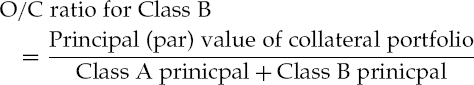
Overcollateralization Tests The overcollateralization or O/C ratio for a tranche is found by computing the ratio of the principal balance of the collateral portfolio over the principal balance of that tranche and all tranches senior to it. That is,
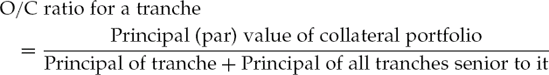
The higher the ratio, the greater protection for the note holders. Note that the overcollateralization ratio is based on the principal or par value of the assets, (Hence, an overcollateralization test is also referred to as a par value test.) An overcollateralization ratio is computed for specified tranches subject to the overcollateralization test. The overcollateralization test for a tranche involves comparing the tranche's overcollateralization ratio to the tranche's required minimum ratio as specified in the CDO's guidelines. The required minimum ratio is referred to as the overcollateralization trigger. The overcollateralization test for a tranche is passed if the overcollateralization ratio is greater than or equal to its respective overcollateralization trigger. (Note that for market value CDOs, overcollateralization tests are based on market values rather than principal or par values.)
Consider our representative CDO. There are two rated tranches subject to the overcollateralization test—Classes A and B. Therefore, two overcollateralization ratios are computed for this deal. For each tranche, the overcollateralization test involves first computing tine overcollateralization ratio as follows:
Once the overcollateralization ratio for a tranche is computed, it is then compared to the overcollateralization trigger for the tranche as specified in the guidelines. If the computed overcollateralization ratio is greater than or equal to the overcollateralization trigger for the tranche, then the test is passed with respect to that tranche.
For our representative deal, the overcollateralization trigger is 113% for Class A and 101% for Class B. Note that the lower the seniority, the lower the overcollateralization trigger. The Class A overcollateralization test is failed if the ratio falls below 113% and the Class B overcollateralization test is failed if the ratio falls below 101%.
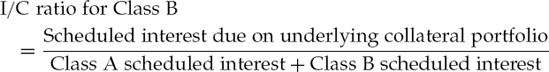
Interest Coverage Test The interest coverage or I/C ratio for a tranche is the ratio of scheduled interest due on the underlying collateral portfolio to scheduled interest to be paid to that tranche and all tranches senior to it. That is,
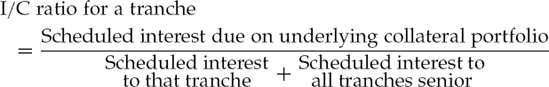
The higher the interest coverage ratio, the greater the protection. An interest coverage ratio is computed for specified tranches subject to the interest coverage test. The interest coverage test for a tranche involves comparing the tranche's interest coverage ratio to the tranche's interest coverage trigger (that is, the required minimum ratio as specified in the guidelines). The interest coverage test for a tranche is passed if the computed interest coverage ratio is greater than or equal to its respective interest coverage trigger.
For our representative deal, Classes A and B are subject to the interest coverage test. The following two interest coverage ratios are therefore computed:
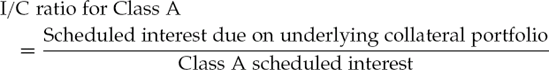
In the case of our representative deal, the Class A interest coverage trigger is 121%, while the Class B interest coverage trigger is 106%.
PIKing Occurs When Coverage Tests are Not Met We showed in Figure 38.1 that if the Class A coverage tests are violated, the excess interest on the portfolio goes to pay down principal on the Class A notes, and cash flows is diverted from the other classes to do so. In this case, what happens to the Class B notes?
They have a pay-in-kind (PIK) feature. This is a clearly disclosed structural feature in most CDOs where, instead of paying a current coupon, the par value of the bond is increased by the appropriate amount. So if a $5 coupon is missed, the par value increases, say from $100 to $105. The next coupon is calculated based on the larger $105 par amount. The PIK concept originated in the high-yield, market, and was employed for companies whose future cash flows were uncertain. The option to pay-in-kind was designed to help these issuers conserve scarce cash or even avoid default. It was imported to the CDO market as a structural feature to enhance the more senior classes.
The PIKability of subordinate tranches and the diversion of cash flows to cause early amortization of the Class A tranche naturally strengthens the Class A tranche. The Class A tranche can therefore either achieve a higher rating, or its size can be increased while still maintaining its original rating. CDO equity holders benefit from an overall lower cost of funds: They either have a lower coupon on the Class A tranche; or the Class A tranche, which enjoys the CDO's lowest funding cost, is larger. Either case lowers interest costs to the CDO and thus increases return to equity holders.
The effectiveness of PIK-ing in bolstering the credit quality of the Class A tranche depends upon the amount of collateral cash flow that exists in excess of Class A coupon. The higher the coupon on collateral, and the longer the tenor of collateral, then the more cash flow potentially available for diversion to pay down Class A principal. The effectiveness of PIKing (in bolstering the Class A tranche) also depends upon the looseness or tightness of the overcollateralization and interest coverage tests. The tighter the coverage tests are to the CDO's original par and coupon ratios, the sooner a deterioration in those ratios will cause cash flow to be diverted to repay Class A principal.
The effect of cash diversion to the Class A tranche in a high-yield-backed CDO can be dramatic. It is not unusual for subordinate tranches of a CDO to have been downgraded (and to be PIKing without any chance of ultimate payment) while the CDO's Aaa tranche maintains its credit quality and rating. That is due to the outlook for Class A receiving full principal and interest because of the diversion of cash to Class A principal.
In determining its optimal capital structure, CDO equity must weigh reduction in the overall cost of CDO debt against the potential for equity to receive less cash flow in severe default scenarios. Distribution of collateral cash flow among tranches in a CDO is a zero-sum game. And since equity receives residual cash flow after debt tranches are satisfied, PIK-ing and the diversion of cash flows to Class A principal affects it the most. First, the CDO's average cost of funds increases. Second, the CDO becomes more delevered. Finally, less cash reaches the equity tranche, and that which does is delayed.
Quality Tests
After the tranches of a CDO deal are rated, the rating agencies are concerned that the composition of the collateral portfolio may be adversely altered by the asset manager over time. Tests are imposed to prevent the asset manager from trading assets so as to result in a deterioration of the quality of the portfolio and are referred to as quality tests. These tests deal with maturity restrictions, the degree of diversification, and credit ratings of the assets in the collateral portfolio.
There are three key inputs to cash flow CDO ratings: collateral diversification, likelihood of default, and recovery rates. While each rating agency uses a slightly different methodology, they reach similar conclusions. For this analysis, we use a variation of Moody's methodology, as it is the most transparent and allows us to change inputs to show the import and impact of each.
Moody's uses the same objective process for developing liability structures regardless of the type of collateral, Moody's determines losses on each tranche under different default scenarios, and probability-weight those results. The resulting "expected loss" is then compared to the maximum permitted for any given rating. While that whole iterative process makes for a tedious analysis, it does help highlight why, for example, a deal backed by investment-grade corporate bonds will have a very high proportion of triple A tranches and a low proportion of equity compared to a deal backed by high-yield corporate bonds.
Collateral Diversification
Moody's methodology reduces the number of credits in the CDO portfolio to a smaller number of homogenous, uncorrelated credits. For example, for CDOs backed by corporate bonds, a diversity score is calculated by dividing the bonds into different industry classifications. Each industry group is assumed to have zero correlation with other industry groups. Two securities from different issuers within the same industry group are assumed, to have some correlation to each other. At the extreme, two securities from the same issuer are treated as having 100% correlation and thus providing zero diversification.
Reducing the portfolio to the number of independent securities allows the use of a binomial probability distribution. This is the distribution that allows one to figure out the probability of obtaining 9 "heads" in 10 flips of the coin. This distribution can also be applied to a weighted coin, where the probability of "heads" is substantially different than the probability of tails. Intuitively, each asset is a separate flip of the coin, and the outcomes ("heads" and "tails") corresponds to "no default" and "default." The use of this probability distribution makes it possible to define the likelihood of a given number of securities in the portfolio defaulting over the life of a deal.
One factor concerning investors in CDOs is the potential for the default on one bond to wipe out the equity. In fact, in addition to the general diversification methodology, there are single-name concentration rules that protect against too large a concentration within securities issued by any single entity. It is customary for issuer exposure to be no more than 2%. To allow asset managers some flexibility, a few exceptions are permitted. In one actual deal, for example, four positions could be as large as 3%, as long as no more than two of these exposures were in the same industry. If two of the exposures greater than 2% were in the same industry, additional restrictions apply.
Historical Defaults
Likelihood of default is provided by the weighted average rating factor (WARF). This is a rough guide to the asset quality of a portfolio and is meant to incorporate the probability of default for each of the bonds backing a CDO. To see where this comes from, we need to look at actual default experience on corporate bonds.
Table 38.3 shows actual average cumulative default rates from 1 to 10 years based on Moody's data from 1983 to 2004. These data show that bonds with an initial rating of Baa3 experienced average default rates of 5.36% after 7 years, and 7.20% after 10 years. Compare that to the Bl default rate of 35.69% after 7 years and 47.43% after 10 years. Generally, as would be expected, bonds with lower ratings exhibit higher default patterns. Moreover, defaults rise exponentially, not linearly, as ratings decline.
However, it is difficult to use these data to construct a stylized default pattern, as some anomalies appear. For example, over some time periods, Aaa bonds default more frequently than do Aal bonds. And Aa2 bonds default more frequently than either Aa3 or Al bonds, while A2 bonds default more frequently than A3 bonds. Correspondingly, B2 bonds default less frequently than either Ba3 or Bl bonds.
Moody's smooths these data and constructs a WARF, shown in Table 38.4. Thus, a bond with a Baal rating has a Moody's score of 260, while one rated Baa3 would have a WARF score of 610. Note that these scores exhibit the same pattern as did actual default numbers: Scores are nonlinear and increase exponentially as ratings decline. These scores are also dollar-weighted across the portfolio to deliver a WARF for the portfolio.
The WARF for the portfolio translates directly into a cumulative probability of default. The cumulative probability of default will be larger the longer the portfolio is outstanding. A WARF score of 610 means that there is a 6.1% probability of default for each of the independent, uncorrelated assets defaulting in a 10-year period.
Table 38.3. Average Issuer-Weighted Cumulative Default Rates by Alphanumeric Rating, 1983-2004 Moody's
Time Horizon (Years) | ||||||||||
|---|---|---|---|---|---|---|---|---|---|---|
Cohort Hating | 1 | 2 | 3 | 4 | 5 | 6 | 7 | 8 | 9 | 10 |
Source: Exhibit 17 in David T. Hamilton, Praveen Vama, Sharon Ou, and Richard Cantor, Default and Recovery Rates of Corporate Bond Issuers: 1920-2004, Moody's Investors Service (January 2005), p. 17. | ||||||||||
Aaa | 0.00 | 0.00 | 0.00 | 0.06 | 0.18 | 0.24 | 0.32 | 0.40 | 0.40 | 0.40 |
Aa1 | 0.00 | 0.00 | 0.00 | 0.15 | 0.15 | 0.25 | 0.25 | 0.25 | 0.25 | 0.25 |
Aa2 | 0.00 | 0.00 | 0.04 | 0.13 | 0.28 | 0.34 | 0.40 | 0.48 | 0.57 | 0.67 |
Aa3 | 0.00 | 0.00 | 0.05 | 0.11 | 0.18 | 0.26 | 0.26 | 0.26 | 0.26 | 0.33 |
A1 | 0.00 | 0.00 | 0.19 | 0.30 | 0.38 | 0.47 | 0.50 | 0.58 | 0.67 | 0.84 |
A2 | 0.03 | 0.08 | 0.22 | 0.47 | 0.68 | 0.89 | 1.05 | 1.34 | 1.59 | 1.69 |
A3 | 0.03 | 0.21 | 0.37 | 0.50 | 0.65 | 0.86 | 1.19 | 1.38 | 1.55 | 1.69 |
Baa1 | 0.17 | 0.50 | 0.84 | 1.14 | 1.46 | 1.69 | 1.92 | 2.05 | 2.21 | 2.31 |
Raa2 | 0.12 | 0.40 | 0.81 | 1.52 | 2.11 | 2.74 | 3.39 | 3.98 | 4.62 | 5.49 |
Baa3 | 0.41 | 1.07 | 1.70 | 2.66 | 3.60 | 4.49 | 5.36 | 6.15 | 6.68 | 7.20 |
Ba1 | 0.66 | 2.07 | 3.55 | 5.23 | 6.76 | 8.67 | 9.70 | 10.85 | 11.61 | 12.38 |
Ba2 | 0.62 | 2.22 | 4.48 | 6.84 | 8.82 | 10.11 | 11.85 | 13.13 | 14.20 | 14.66 |
Ba3 | 2.23 | 6.10 | 10.62 | 15.03 | 19.14 | 23.05 | 26.56 | 30.00 | 33.35 | 36.24 |
B1 | 3.03 | 8.89 | 14.81 | 20.09 | 25.27 | 30.29 | 35.69 | 39.97 | 43.98 | 47.43 |
B2 | 5.93 | 13.73 | 20.58 | 26.58 | 31.24 | 34.54 | 37.39 | 39.60 | 42.19 | 44.48 |
B3 | 10.77 | 20.43 | 29.01 | 36.82 | 43.55 | 49.74 | 54.46 | 58.40 | 61.02 | 62.32 |
Caa-C | 22.24 | 35.80 | 46.75 | 54.60 | 60.40 | 65.15 | 68.30 | 72.36 | 75.38 | 78.81 |
Investment grade | 0.08 | 0.23 | 0.43 | 0.71 | 0.96 | 1.21 | 1.43 | 1.65 | 1.84 | 2.03 |
Speculative grade | 5.26 | 10.84 | 16.06 | 20.63 | 24.54 | 28.00 | 31.04 | 33.63 | 35.87 | 37.66 |
All rated | 1.79 | 3.66 | 5.38 | 6.89 | 8.13 | 9.17 | 10.04 | 10.75 | 11.35 | 11.83 |
Table 38.4. Moody's Weighted Average Rating Factor
Rating | WARF | Rating | WARF | Rating | WARF |
|---|---|---|---|---|---|
Source: Moody's Investors Service. | |||||
Aaa | 1 | Baa1 | 260 | B1 | 2,220 |
Aa1 | 10 | Baa2 | 360 | B2 | 2,720 |
Aa2 | 20 | Baa3 | 610 | B3 | 3,490 |
Aa3 | 40 | Ba1 | 940 | Caa1 | 4,770 |
A1 | 70 | Ba2 | 1,350 | Caa2 | 6,500 |
A2 | 120 | Ba3 | 1,780 | Caa3 | 8,070 |
A3 | 180 | Ca/C | 10,000 | ||
(In general, the WARF score translates directly into the 10-year "idealized" cumulative default rate.) The same 610 WARF would correspond to a 4.97% probability of default after eight years, or a 5.57% probability of default after nine years.
When the desired rating on the CDO tranche is the same as the rating on the underlying collateral, Moody's uses the probability of default derived from the WARF score. For CDO ratings higher than the ratings on their underlying collateral, Moody's will use a higher default rate. The multiple applied to the idealized cumulative default rate is referred to as a stress factor. Thus, for example, in an investment-grade deal (Baa-rated collateral), Moody's uses a factor of 1.0 to rate a Baa tranche. If the rating on the CDO tranche is Aaa, Aa, or A, then Moody's uses a higher factor to stress the default rates.
Recovery Rates
Moody's recovery rates are dependent on the desired rating of the CDO tranche. To obtain the highest ratings (Aaa and Aa), Moody's generally assumes recovery rates of 30% on unsecured corporate bonds. To obtain an A or Baa rating, recovery assumptions are slightly higher, at 33% and 36%, respectively. It should be understood that actual average recovery rates are higher than these assumptions. A Moody's study covering the period 1981 to 2004 showed that the median, or midpoint, recovery rate for senior unsecured debt was $45.20 ($44.90 average or mean). For subordinated unsecured debt, the median recovery rate was $33.40 ($32.00 average). The bottom line is this: Moody's is again conservative, as it uses a recovery value consistent with subordinated unsecured debt on debt that is in most cases senior—and that builds in "extra" protection for the investors.
Putting It All Together
Moody's has an expected loss permissible for each CDO rating. That expected loss is derived as follows:
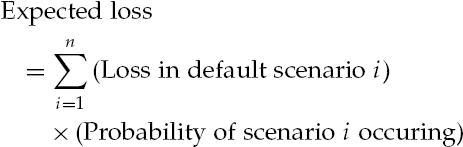
The following example, using an investment-grade corporate CDO, helps clarify this formula. Assume a typical CDO deal with 45 independent assets. Assume further that we are looking at a 10-year deal in which each asset has a probability of default of 5% corresponding to a WARF score of 500, which is well within the category of Baa-rated assets. Moreover, we assume a capital structure with 85% of the bonds Aaa-rated, 10% Baa-rated, and 5% equity. The recovery rate is assumed to be 30%.
To create an example that can be replicated with a simple spreadsheet, we assume all interim cash flows are distributed, and all defaults occur at the end of the life of the deal. Moody's actually runs each scenario through its CDO cash flow model in order to determine the loss to each bond in the CDO structure. Then Moody's assumes a number of different loss schedules and select the most detrimental.
We have simplified that whole analytical process to make it more transparent. Our methodology overstates losses to the bondholders, since we ignored all overcollateralization and interest coverage tests. As the portfolio deteriorated, those two tests kick in and would cut off cash flow to the equity tranche, redirecting cash flows to pay down the higher-rated tranches. We have also ignored the excess spread on these deals, which provides a very important cushion to the noteholders.
The probability of a scenario in which none of the 45 securities default is (probability of no default)45, or (0.95)45. This is equal to 9.94%. If there are zero defaults, there is obviously no loss. The probability of only one loss is found as follows:
This frequency distribution for a selected number of defaults is shown in the column of Table 38.5, labeled "Probability."
With one default, the defaulted bond comprises 1/45 of the portfolio, or 2.22%. However, since a 30% recovery rate is assumed, that loss is lowered to 1.56% (2.22 × 0.7). Thus, the "Portfolio Loss" column of Table 38.5 shows that the loss with one default would be 1.56%. But the 5% equity in the deal acts as a buffer, and there would be no loss to the BBB bond. In order to impact the BBB bond, losses must total more than 5%.
Assume four defaults among the 45 assets. This means that 8.89% of the assets (4/45) are defaulting, and portfolio loss becomes 6.22% (8.89% × 0.7). The probability of this occurring is 11.37%. If that case does occur, the Baa bond would lose 12.22% of its value. That is, the equity would be eliminated, and the $10 Baa tranche ($10 per $100 par value), would be reduced by ($6.22 – $5.00), or $1.22, for a 12.22% reduction. Thus,
Similarly, if there were five defaults (a 4.92% probability), the portfolio loss would be 7.78%. This corresponds to a loss of 27.78% on the Baa bond. The expected loss to the Baa bond in this scenario is (4.91 × 27.78), or 1.3629%. Note that if portfolio losses total more than 15%, the Baa bond is eliminated, and only then does the Aaa bond, start incurring losses.
Table 38.5. Expected Loss on BBB Class, Investment-Grade CDO Deal (Given 45 Assets)
No. of securities: 45, Default probability: 5%, Loss given default: 70% | Portfolio loss for single default: 1.56% (1/45 × 70%) Expected BBB loss: 3.9205% | |||
|---|---|---|---|---|
No. of Defaults | Portfolio Loss (%) | Probability (%) | BBB Loss (%) | BBB Loss × Probability (%) |
0 | 0.00 | 9.94 | 0.00 | 0.0000 |
1 | 1.56 | 23.55 | 0.00 | 0.0000 |
2 | 3.11 | 27.27 | 0.00 | 0.0000 |
3 | 4.67 | 20.57 | 0.00 | 0.0000 |
4 | 6.22 | 11.37 | 12.22 | 1.3895 |
5 | 7.78 | 4.91 | 27.78 | 1.3629 |
27 | 42.00 | 0.00 | 100.00 | 0.0000 |
28 | 43.56 | 0.00 | 100.00 | 0.0000 |
29 | 45.11 | 0.00 | 100.00 | 0.0000 |
30 | 46.67 | 0.00 | 100.00 | 0.0000 |
31 | 48.22 | 0.00 | 100.00 | 0.0000 |
32 | 49.78 | 0.00 | 100.00 | 0.0000 |
42 | 65.33 | 0.00 | 100.00 | 0.0000 |
43 | 66.89 | 0.00 | 100.00 | 0.0000 |
44 | 68.44 | 0.00 | 100.00 | 0.0000 |
45 | 70.00 | 0.00 | 100.00 | 0.0000 |
Adding expected losses in each of the scenarios across the binomial probability distribution, we find that the expected loss on this Baa CDO tranche is 3.92%. Realize again that this example is for illustrative purposes and will overstate losses to the bondholders. It ignores overcollateralization and interest coverage ratios and the excess spread in the deal.
Importance of Diversification We can now readily show the importance of diversification. No matter how many assets we have, if the probability of default on each is 5% and recovery is 30%, then the expected loss on the portfolio is 3.5%. However, this does not address the distribution of losses, which is certainly important to the bondholders.
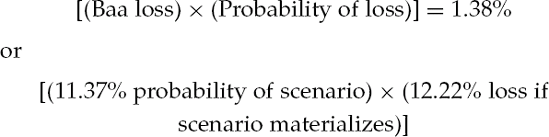
In fact, the Baa bondholders are concerned about the likelihood of losses exceeding the amount of equity in the deal, while the Aaa bondholders are concerned about the likelihood of losses exceeding the amount of equity and Baa bonds. The greater the number of assets, the greater the likelihood that losses on those assets will cluster around 3.5% and the lower the likelihood that losses will exceed the 5% equity cushion and impact the Baa piece. On the flipside, the smaller the number of assets, the greater the likelihood that losses exceed the 5% equity cushion and will hit the Baa bonds.
Figure 38.3 shows probability distributions for losses on pools of 15, 30, and 45 securities. Note that the fewer the number of assets, the greater likelihood that losses will exceed a 5% equity cushion.
Table 38.6 supports the point that with fewer assets, expected losses to the Baa-rated tranche are much higher. Thus, for 15 assets, the loss to the Baa tranche is 9.15%; for 30 assets it is 5.62%. For 45 assets, the loss to the Baa tranche is 3.92%; and for 60 assets, it is 2.92%, Note also that the benefits of diversification diminish as more assets are added. The loss to the Baa tranche is 5.5% lower in moving from 15 to 30 assets. It only drops 1.7% in moving from 30 to 45 assets and only 1% from 45 to 60 assets.
Table 38.6. Diversity and Expected Losses, %
No. of Securities | 15 | 20 | 25 | 30 | 45 | 60 |
|---|---|---|---|---|---|---|
Aaa losses | 0.0273 | 0.0091 | 0.0032 | 0.0012 | 0.0001 | 0.0000 |
Baa losses | 9.1520 | 8.5074 | 6.8720 | 5.6216 | 3.9205 | 2.9262 |
What's "Too Much" Diversification? The above analysis suggests that greater diversification is always better, since it means less variation of collateral returns. However, a higher diversity score also means that it may be likely the asset manager pushed for, and achieved, less equity in the deal. In fact, with a diversity score of 60, the same losses on the Aaa and Baa bonds could have been achieved with less equity (on the order of 4.5% rather than the 5% required on a deal with a diversity score of 45).
Is there any such thing as too much of a diversification "good thing"? That depends on the asset manager. A large, broad-based asset manager may have considerable strength across all sectors and should be able to handle the analysis—and risks—of a highly diverse portfolio. Even here, a very high diversity score can limit flexibility by requiring an asset manager with broad expertise to invest in an industry he does not like. Whether or not flexibility is being limited too much by a very high diversity score is dependent on the range of assets employed and the strengths of a particular asset manager.
Too much diversification, is even more a major problem for a smaller asset manager, where the portfolio may have selective strengths in fewer industries. This asset manager may be stretching to take on additional diversity to achieve a lower required equity. Investors should certainly be wary of deals in which very high diversity scores are achieved by managers straying from their fields of expertise.
Loss Distribution Tests
As can be seen from the discussion above, Moody's approach to rating CDOs involves (1) developing a diversity score; (2) calculating a weighted average rating factor; (3) using the binomial distribution to determine the probability of a specific number of defaults; and (4) calculating the impact of those defaults on bonds within the CDO structure. One element needed to calculate that impact is a distribution of defaults and losses across time. Let us look at this distribution of defaults and losses.
Moody's stresses CDOs via six different loss distributions, and a CDO tranche must pass each test. Moody's basic approach assumes 50% of the losses will occur at a single point in time, and that remaining losses are evenly distributed over a 5-year period. This single 50% loss is assumed to occur at a different point in each of the six tests.
Liability Structure
The structure of the liabilities will be primarily determined by the credit quality of the assets, the amount of diversification, and excess spread. That is, the combination of credit quality, diversification of assets, and excess spread dictate expected losses on each tranche. That is then compared to losses allowed to achieve a given rating. Realize that the structures have been optimized. If a structurer sees one of the tranches passing expected loss tests by a large margin, that means there is room to improve the arbitrage. That can be accomplished by leveraging the structure more (that is, reducing equity, reducing the amount of mezzanine bonds, or both).
Uses of Interest Rate Swaps and Caps in CDO Transactions
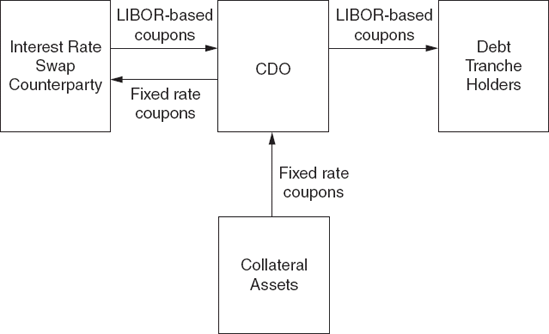
We have mentioned that a wide variety of collateral can be used to back CDO deals. Some of this collateral (high-yield bonds, investment-grade bonds) have fixed rate coupons, some (high-yield loans) have floating-rate coupons. SF collateral may be fixed or floating. CDO liabilities are usually LIBOR-based floating instruments. To convert a fixed rate asset into a floating rate liability, it is necessary to use either an interest rate swap or a cap.
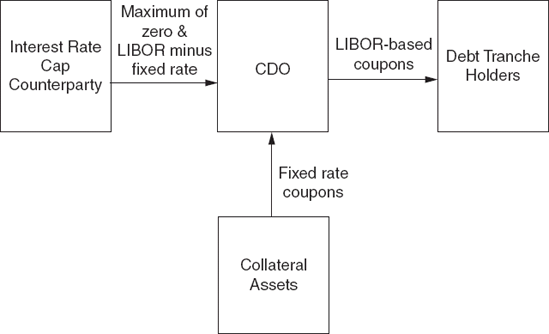
Figure 38.4 shows how this is done. The CDO enters into a swap with an interest rate swap counterpart. The CDO pays a fixed rate coupon to the swap counterparty, and receives a LIBOR-based coupon from the swap counterparty, Figure 38.5 shows a bond-backed CDO using an interest rate cap. With an interest rate cap, the CDO makes an upfront payment, and receives a payment only if LIBOR is over a certain prespecified level. This protects the deal against the scenario in which LIBOR spikes, and the fixed rate coupons on the assets are insufficient to cover the cash flow on the liabilities.
The use of an interest rate swap or cap requires assumptions about the cash flows on the assets. If the assets run off more quickly than anticipated, the CDO can be left with the swaps in place, and no assets.
The commonly used optional redemption features in CDO transactions is where the deal is callable at par by the equity holders, after a prespecified lockout. The call is generally exercised when the deal is doing very well, and the collateral can be liquidated at a healthy net profit. The deal is more apt to be called when the spreads on the debt tranches have narrowed. That is, the equity holders are looking at the possibility of liquidating the deal, paying off the debt holders, and putting the collateral into a new deal where the debt holders are paid a narrower spread. When evaluating CDOs that have been outstanding for a few years and are being traded in the secondary market, call provisions can be important to the valuation of the securities.
Call Protection for Bond Investors
There are many different variations of the basic CDO structure in which the deal is callable at par after a preset lockout period. Two of the most common variations protecting bondholders are prepayment penalties and coupon step-ups.
Prepayment penalties can take two forms: Either the investor is compensated with a premium call, or there is a "make-whole" provision. The most typical premium call is an amount equal to one-half the annual coupon, which steps down over time. Essentially, the effect of the prepayment penalties is to make the call less attractive to the asset manager.
Coupon step-ups are somewhat rare in deals. If the tranche is not called on a certain date, the coupon "steps up" to a higher level. A coupon step-up is only used if the asset manager wants to signal to investors that it is unlikely that the deal will extend beyond a certain point. For example, deals backed by collateral with long legal final maturities are more apt to have a coupon step up to quell investor concerns about extension risk.
Variations of Call Provisions that Benefit Equity Holders
Not all call provisions will be exercised because the deal is going well. Sometimes if the deal is going very poorly, the equity holders may choose to liquidate because the deal is worth more "dead" than alive. This is particularly true towards the end of the deal because the expenses of running a small deal with low leverage are too high and a "clean-up call" is beneficial.
There are also customized call provisions to protect the equity holders from the whims of an asset manager. Some CDO deals have "partial calls," which allows each group of equity holders to exercise authority over their own piece of the deal. This is different from typical structures, in which the deal is only callable in whole by a majority of the equity interests. It is clear that the value of the deal on an ongoing basis will be different for the asset manager (who earns management fees) and an equity holder (who does not). In certain rare cases, a majority of equity holders may replace the asset manager. This is most common in those deals in which the asset manager does not own a piece of the equity. Both of these call provisions are meant to protect the equity holder (who is not the asset manager) at the expense of the asset manager.
In this section, we review synthetic CDOs. More specifically, our focus is on synthetic arbitrage CDOs. A synthetic CDO does not actually own the portfolio of assets on which it bears credit risk. Instead, it gains credit exposure by selling protection via credit default swaps. In turn, the synthetic CDO buys protection from investors via the tranches it issues. These tranches are responsible for credit losses in the reference portfolio that rise above a particular attachment point; each tranche's liability ends at a particular detachment or exhaustion point. The motivation in an arbitrage synthetic CDO is investors' desire to assume tranched credit risk in return for spread.
Synthetic arbitrage CDOs come in the following forms:
The oldest are full-capital structure CDOs that include a full complement of tranches from super senior to equity. These CDOs have either static reference portfolios or a manager who actively trades the underlying portfolio of credit default swaps (CDS).
Single-tranche CDOs are newer, and are made possible by dealers' faith in their ability to hedge the risk, of a CDO tranche through single-name CDS. Single tranche CDOs often allow CDO investors to substitute credits and amend other terms over the course of the CDOs' life.
Standard tranches of credit default swap indices are the most liquid type of CDOs. These instruments allow long-short strategies that appeal to certain types of investors.
Next we outline the features of these types of synthetic arbitrage CDOs.
Full capital structure synthetic arbitrage CDOs come in many forms. The best way to explain the differences is to focus on two CDO types that represent the range of structural variations.
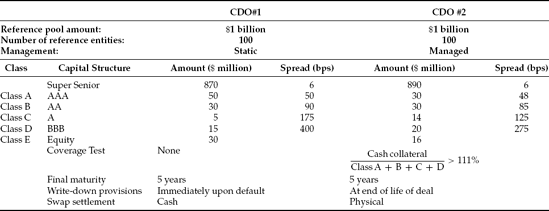
The first has a static reference portfolio of 100 investment-grade names which we will refer to as CDO #1. The second, which we refer to as CDO #2, is managed with roughly the same underlying credit quality as CDO #1. Salient features of each of the two CDOs, including capital structures and spreads, are shown in Table 38.7.
Static versus Managed
Synthetic arbitrage CDOs can be done as static pools or as managed transactions. The advantage to static CDOs is that the investor can examine the proposed portfolio before closing and know that the portfolio will not change. The investors can ask that certain credits be removed from the portfolio or can decide not to invest in the CDO at all. There are also no ongoing management fees. The disadvantage to a static deal becomes apparent if an underlying credit begins to deteriorate, because no mechanism exists for the CDO to rid itself of the problem credit, which remains in the portfolio and may continue to erode.
Capital Structure
Observe from Table 38.7 that static synthetic CDO #1 has much higher equity (3% versus 1.6%) and no coverage tests. The higher equity percentage is a reflection of the absence of coverage tests. The key to understanding the smaller size of the equity tranche in CDO #2 is the structure of its interest waterfall.
First the trustee fee, the senior default swap fee, and the senior advisory fee are all paid out of the available collateral interest and CDS premium receipts. Next interest is paid to the various note holders, from Class A to Class D, in order of their seniority. Then, a coverage test is conducted. If the coverage test is passed, remaining funds are used to pay the subordinate advisory fee, and the residual cash flow goes to equity holders.
But if the coverage test is failed, cash flow is trapped in a reserve account. Cash in the CDO's reserve account is factored into the coverage test, helping the CDO to meet its required ratio. If the coverage test comes back into compliance, future excess cash flows can be released to the subordinate advisory fee and to equity holders. At the CDO's maturity, cash in the reserve account becomes part of the principal waterfall and helps to pay off tranches in order of their seniority.
Despite the different proportions of equity in the two CDOs, the credit protection enjoyed by rated tranches in each CDO is about equal. This is so because credit protection is measured not only by the amount of subordination below a tranche, but also by how high credit losses can be on the underlying portfolio before die tranche's cash flows are affected. In this case, the rated tranches from both CDOs can survive approximately the same level of default losses; the lower amount of equity in CDO #2 is compensated for by its coverage test and cash trap mechanism.
Settlement on Credit Default Swaps
Note in Table 38.7 that CDO #1 uses cash settlement on the reference pool of assets, while CDO #2 uses physical settlement. There are advantages and disadvantages to both. Cash settlement is simple and filial, thus one generally sees cash settlement in static deals. With physical settlement, the CDO has to deal with the defaulted debt that has been delivered to it. In a managed CDO, however, the manager can decide whether to sell the debt immediately or hold it in hope of realizing a .higher market value later. Physical settlement tends is more common than cash settlement in managed deals.
Equity Cash Flows and the Timing of Write-Downs
In CDO #1, equity is paid a fixed coupon, and thus has no claim on the residual cash flows of the CDO. Equity holders receive interest only on the outstanding equity balance. In CDO #2, the equity holders have a claim on all residual cash flows of the CDO.
The timing of write-downs is very different for the two CDOs. In CDO #1, there is a cash settlement whenever a credit event occurs. Thus, when a credit event occurs (1) that credit is removed from the pool; (2) the CDO pays default losses; and (3) the lowest tranche in the CDO is written down by the amount of default losses. If equity is written down to zero, further losses are written down against the next most junior tranche and so on, moving up the CDO's capital structure.
By contrast, when a credit event occurs in CDO #2, physical settlement occurs. The security can be sold, but there is no write-down until the end of the deal. At that time, the principal cash flows go through the principal waterfall, paying off first the Class A note holders and then those in Class B, C, and D. After note holders are paid, remaining funds go to the equity holders.
Because of these structural differences and investor taste, the BBB and lower classes in CDO #1 generally sell wider than they do in CDO #2. In Table 38.7, the BBB tranche is shown at LIBOR + 400 in CDO #1; it is only LIBOR + 275 in CDO #2. In CDO #1, the write-downs are immediate, and there is no way to recoup losses by better performance later in the deal's life. Moreover, if any of the classes (including the equity) incur losses, their interest is reduced accordingly.
How "Arbitrage" Are Synthetic Arbitrage CDOs?
We have called the CDOs discussed "arbitrage" CDOs. We now look at that label more closely. In some synthetic CDOs, particularly in static portfolio CDOs, the selection of underlying credits is constrained by the availability of risk at the specific bank putting together the CDO.
What do we mean by this? By this we mean that potential equity investors in a synthetic CDO go to a bank with a list of credits on which they want to sell first loss protection. In practice, the final selection of the portfolio depends upon names that the bank either is exposed to already or can become exposed to quickly.
If the bank has an imbalance in its single-name CDS book (which was caused by having sold more protection on a particular name than it has purchased), it will be interested in buying protection on that name from an "arbitrage" CDO. Sometimes the bank's desire to buy credit protection on a particular name derives from exposures built up in other activities. For example, the bank might be exposed to a certain counterparty on interest rate and currency derivatives. In that case, the bank may be interested in buying protection from a CDO. Sometimes the bank can sell protection on a particular name, thereby creating the need to buy protection from a CDO.
The issue of the availability of credit exposure gives these "arbitrage" CDOs a certain balance sheet feel. This is less true in the case of managed synthetic CDOs, where the manager can offer to sell credit protection to a number of banks. Another "arbitrage" synthetic CDO with a balance sheet favor is the CDO driven by a bank's desire to lay off the credit risk of a bond portfolio it owns. The bank thereafter becomes the funder of the bond portfolio without being the owner of its credit risk.
Single-tranche CDOs are notable for what they are not: the placement of a complete capital structure complement of tranches, from equity to super senior. Instead, a protection seller enters into one specific CDO tranche with a CDS dealer in isolation.
This arrangement creates an imbalanced position for the CDS dealer. For example, it might have bought protection on the 3% to 7% tranche of a synthetic CDO comprising 150 underlying Investment-grade names. The CDS dealer will sell protection on these names in the single-name CDS market, varying the notional amount of protection it buys from name to name, in a process called delta hedging.
While there are concerns with using delta hedging, because CDS dealers believe in its efficacy, protection sellers enjoy great flexibility in choosing the terms of single tranche CDOs. (Any losses dealers incur in delta hedging do not affect the terms or economics of the single-tranche CDO.) Protection sellers can choose the portfolio they wish to reference, as well as the attachment and detachment points of the tranche they wish to sell protection on. These factors will imply a price for that protection.
Alternatively, the protection seller can start with a premium in mind and then negotiate other terms to create a transaction furnishing that premium. Because there are only two parties to the transaction, execution can be quicker than it would be with a full-capital structure CDO encompassing many constituencies.
The single-tranche synthetic CDO can also provide flexibility over its life. As reference credits in the underlying portfolio either erode or improve in credit quality, the value of the CDO changes. If, for example, reference credits have all been severely downgraded, the value of credit protection increases because it is more likely there will be default losses. A protection seller of such a single-tranche CDO might be willing to pay a fee to terminate the CDO early rather than be exposed to default losses later.
Single-tranche CDO investors can go back to the original dealer to reverse out of a trade, or they can reverse the trade with another dealer. If investors have sold protection to dealer A, for example, they can buy protection on the exact terms from dealer B. This would leave them with offsetting trades. In many cases, dealers will allow the investor to step out of the trades completely, and the two dealers will face each other directly.
Many single-tranche synthetic CDOs have a feature where terms of the CDO are adjustable over its life. Recall the example where underlying credits have severely deteriorated. Protection sellers might be allowed to replace a soured credit with a better one for a fee. Or, instead of paying a fee, the terms of the CDO tranche might change. In exchange for getting rid of a troubled underlying credit, the attachment point might be decreased, or the detachment point might be increased, or the premium might decrease.
The last type of synthetic CDO we will discuss are those whose underlyings are indices of credit default swaps (see Table 38.8). The terms of these CDO tranches are so standardized and their trading is so liquid that they are typically sold directly from the dealer's trading desk, rather than marketed via term sheets, pitch books, memorandums, and road shows. In fact, pricing on more custom synthetic CDOs often reflects prices in the standard tranche market. The reason standard tranches are so liquid is that they are based on liquid credit default swap indices.
Table 38.8. Credit Default Swap Indices
Geographic Concentration | Main Index Name | Main Index Composition | Subindices |
|---|---|---|---|
North America investment grade | Dow Jones CDX NA 1G | 125 corporate names | 5 Industries: Consumer, Energy, Financials, Industrials, and Technology/Media/Telecom |
High Volatility | |||
North American high yield | Dow Jones CDX NA HY | 100 corporate names | BB-rated |
B-rated | |||
High Beta | |||
Europe | Dow Jones iTraxx Europe | 125 corporate names | 9 Industries: Autos, Consumer, Consumer Cyclicals, Consumer Non-Cyclicals, Energy, Senior Financials, Subordinate Financials, Industrials, and Technology/Media/Telecom |
Largest Corporates | |||
Lower Rated (aka Crossover) | |||
High Volatility | |||
Japan | Dow Jones iTraxx CJ Japan | 50 corporate names | 3 industries: Capital Goods, Financials, Technology High Volatility |
Asia ex-Japan | Dow Jones iTraxx Asia ex-Japan | 50 corporate and sovereign names | 3 Geographies: China and Taiwan, Korea, and the rest of ex-japan Asia |
Australia | Dow Jones iTraxx Australia | 25 corporate names | None |
Emerging market | Dow Jones CDX EM | 15 sovereign names | None |
Emerging market diversified | Dow Jones CDX EM Diversified | 40 sovereign and corporate names | 3 Geographies: Asia, EEMEA, Latin America |
The desire of market participants to go long or short a portfolio of underlying names at the same time led to the establishment in 2003 of rival CDS indices, Trac-X and iBoxx. These indices merged in early 2004, deepening the liquidity of the consolidated indices. New indices and subindices have since been added. The composition of the indices and subindices is provided at www.markit.com. Each name in an index is equally weighted in the indices. For the North American indices, only Bankruptcy and Failure to Pay are credit events even though Modified Restructuring is commonly a credit event in the North American market. For the European indices, Bankruptcy, Failure to Pay, and Modified-Modified Restructuring are credit events.
These broad indices are available in maturities from one to 10 years, with the greatest liquidity at 5-, 10-, and, to a lesser extent, 7-year maturities. A new index series is created every six months. At that time, the specific composition of credits in each new series is determined and a new premium level determined for each maturity. Premiums on indices are exchanged once a quarter on the 20th of March, June, September, and December. Over the life of the index, the index's premium remains fixed. To compensate for changes in the price of credit protection, an upfront payment is exchanged. This upfront payment can be regarded as the present value of the difference between the index's fixed premium and the current market premium for the index.
Indices are static and as credit events occur, protection sellers make protection payments to protection buyers, and the notional amount of the index then decreases. It is important to realize that CDS index trades are bilateral agreements. There is no exchange and only recently have there been attempts to centralize the determination of protection payments. Otherwise, protection payments are subject to individual physical settlements.
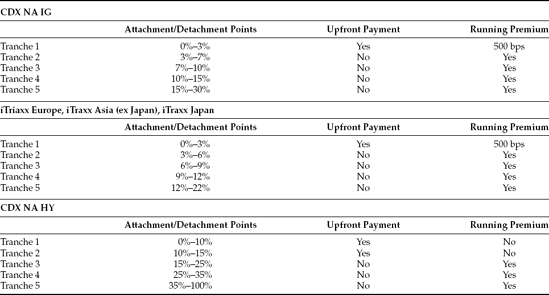
We begin with a description of how the tranches of the CDS indices are quoted and traded like liquid synthetic CDO tranches. As shown in Table 38.9, the Dow Jones CDX.NA.IG is divided up into 0% to 3%, 3% to 7%, 7% to 10%, 10% to 15%, and 15% to 30% tranches. The lower and higher percentage for each tranche represents that tranche's attachment point and detachment point, respectively. When the cumulative percentage loss of the portfolio of reference entities reaches the attachment points, investors in that tranche begin to lose their principal, and when the cumulative percentage loss of principal reaches the detachment point, those investors lose all their principal and no further loss can occur to them. For example, in Table 38.9, the Tranche 3 has an attachment point of 7% and a detachment percentage of 10%. The tranche will be used to cover the cumulative loss during the life of a CDO in excess of 7% (its attachment point) and up to a maximum of 10% (its detachment point).
For the investment-grade indices, equity tranches require an upfront payment from the protection buyer to the protection seller. After that, a fixed 500 bps per annum is exchanged. For the high-yield index, the first two tranches require upfront payments but have no running fee. The higher tranches of the indices trade solely on their running fees. Table 38.9 gives details of tranche structure for various CDS indices.
Investors in standard tranches often engage in various forms of long/short trades. The tranche's liquidity makes them ideal for bets on relative price relationships among the tranches. Investors might sell protection on an equity or first-loss tranche and buy protection on a more senior tranche of the same index. In market parlance, they are said to be long the equity tranche and short the more senior tranche. Being long a tranche can be confusing to some investors because one has sold protection on it, but the situation is analogous to being long a bond. When one is long a bond or long a standard tranche (having sold protection), an investor abhors a default and does not want cash or synthetic credit spreads to widen.
Another popular long/short trade is to sell protection on a tranche in a longer maturity and then to buy protection on the same tranche from the same index in a shorter maturity. Hedge funds are big participants in long/short strategies via the standard tranches of credit default swap indices.
CDOs incorporate ever-evolving structures that have rapidly gained acceptance in the market. In this chapter, we provide an overview of cash and synthetic CDOs, with special attention to the cash flow credit structure, credit rating agencies' methodologies, interest rate hedging, and CDO call features. No doubt, other forms of CDOs will be invented and current forms will fall into disuse. But at least for now, our CDO Structural Matrix in Table 38.2 provides a good way to categorize the different features of CDOs.
Choudhry, M., and Fabozzi, F. J. (2003). Originating collateralized debt obligations for balance sheet management. Journal of Structured and Project Finance, Fall: 32-52.
Fabozzi, F. J., Davis, H., and Choudhry, M. (2006). Introduction to Structured Finance. Hoboken, NJ: John Wiley & Sons.
Fabozzi, F. J., and Goodman, L. S. (eds.) (2001). Investing in Collateralized Debt Obligations. Hoboken, NJ: John Wiley & Sons.
Lucas, D. J., Goodman, L. S., and Fabozzi, F. J. (2006). Collateralized Debt Obligations: Structures and Analysis, 2nd edition. Hoboken, NJ: John Wiley & Sons.
Lucas, D. J., Goodman, L. S., Fabozzi, F. J., and Manning, R. J. (2007). Developments in the Collateralized Debt Obligations Markets: New Products and Insights. Hoboken, NJ: John Wiley & Sons.