MOORAD CHOUDHRY, PhD
Head of Treasury, KBC Financial Products, London
Abstract: The use of interest rate swaps to manage and hedge interest rate risk exposure is widespread. The rate payable on a swap is a positive spread above the sovereign benchmark rate, reflecting interbank quality credit risk. The magnitude of this spread is dependent on various factors, including prevailing macro-level political and economic circumstances, supply and demand, the shape and level of the yield curve, and market volatility. Market practitioners analyze these factors and anticipate changes in the spread, as the extent of the spread feeds into hedge costs. Funding and hedging costs also reflect overall term premium rates. The level of the term premium in the short-term yield curve is a function of the current shape of the curve and market expectations of interest rate levels in the future.
Keywords: futures curve, interest rate swap, LIBOR curves, LIBOR spread, swap spread, term premium
An important hedging tool in bank asset-liability management (ALM) operations is the interest rate swap, a derivative instrument. In this chapter, we consider an important issue for interest rate analysis, the swap spread. Specifically, we look at the spread of the swap curve over the government bond yield curve; this subject is important because the swap spread is an indicator of value and risk premium in the market, as well as an indicator of the overall health of the economy. Understanding the determinants of the swap spread is worthwhile for ALM practitioners for this reason. In the second part of this chapter we look at a related area: the magnitude of the term premium. Given "normal" market conditions, what should be the extent of the term premium of the (under normal conditions, positively sloping) yield curve? The two subjects are related because they both represent a measure of risk premium in the economy at any given point in time.
Interest rate swaps are an important ALM and risk management tool in banking markets. The rate payable on a swap represents bank risk, if we assume that a swap is paying (receiving) the fixed swap rate on one leg and receiving (paying) London Interbank Offered Rate (LIBOR) flat on the other leg. If one of the counterparties is not a bank, then either leg is adjusted to account for the different counterparty risk; usually, the floating leg will have a spread added to LIBOR. We can see that this produces a swap curve that lies above the government bond yield curve, if we compare Figure 46.1 with Figure 46.2. Figure 46.1 is the U.S. dollar (USD) swap rates page from Tullett & Tokyo brokers as of July 3, 2006; Figure 46.2 is the U.S. Treasury yield curve for the same day. The higher rates payable on swaps represent the additional risk premium associated with bank risk compared to government risk. The spread itself is the number of basis points the swap rate lies above the equivalent-maturity government bond yield, quoted on the same interest basis.
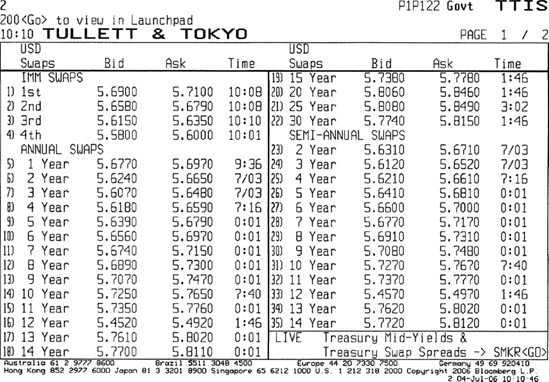
Figure 46.1. Brokers USD Interest Rate Swaps Page on Bloomberg, July 3, 2006 Source: © Bloomberg L.P. Reproduced with permission. All rights reserved. Visit www.bloomberg.com http://www.bloomberg.com
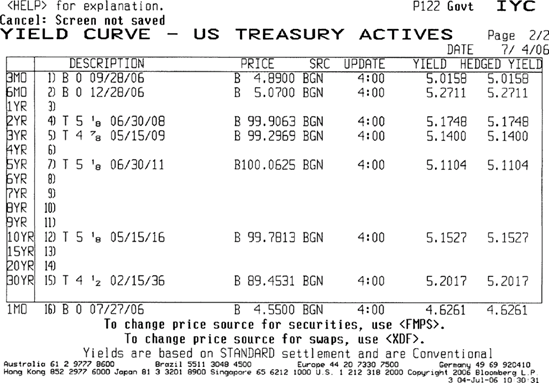
Figure 46.2. U.S. Treasury Yield Curve on July 3, 2006 Source: © Bloomberg L.P. Reproduced with permission. All rights reserved. Visit www.bloomberg.com http://www.bloomberg.com
In theory, the swap spread represents only the additional credit risk of the interbank market above the government market. However, as the spread is variable, it is apparent that other factors influence it. An ALM desk will want to be aware of these factors, because they influence swap rates. Swaps are an important (if not the most important) risk-hedging tool for banks, so it becomes necessary for practitioners to have an appreciation of what drives the swap spreads.
We already noted that in theory the swap spread, representing interbank counterparty risk, should reflect only the market's perception of bank risk over and above sovereign risk. Bank risk is captured in LIBOR—the rate paid by banks on unsecured deposits to other banks. (In fact, banks are more likely to pay LIMID to other banks, and the biggest banks pay London Interbank Bid Rate [LIBID]. But we can safely ignore this for the purposes of our discussion here.) So, in other words, the swap spread is meant to compensate adequately against the risk of bank default. LIBOR is the floating rate paid against the fixed in the swap transaction, and moves with the perception of bank risk.
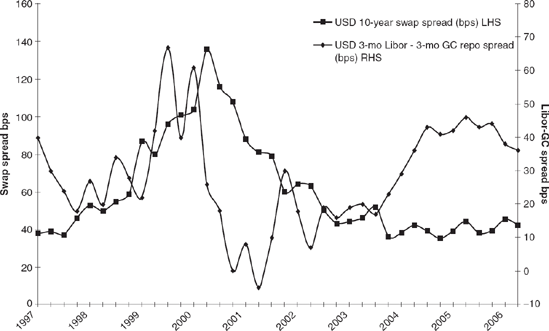
Other factors influence the swap spread. We can illustrate this better comparing the swap spread for 10-year quarterly paying swaps with the spread between 3-month LIBOR and the 3-month general collateral (GC) repo rate. The GC rate is the risk-free borrowing rate, whereas the LIBOR rate represents bank risk again. In theory, the spread between 3-month LIBOR and the GC rate should therefore move closely with the swap spread for quarterly resetting swaps, as both represent bank risk. A look at Figure 46.3 shows us that this is not the case. Figure 46.3 compares the two spreads in the U.S. dollar market, but we do not need to calculate the correlation or the R2 for the two sets of numbers. Even on cursory observation, we can see that the correlation is not high. Therefore, we conclude that other factors, in addition to perceived bank default risk, drive one or both spreads. These other factors influence swap rates and government bond yields, and hence the swap spread, and we consider them in this chapter.
Level and Slope of the Yield Curve
The magnitude of the swap spread is influenced by the absolute level of base interest rates. If the base rate is 10%, so that the government short-term rate is around 10%, with longer-term rates being recorded higher, the spread tends to be greater than that seen if the base rate is 5%. The shape of the yield curve has even greater influence. When the curve is positively sloping, under the expectations hypothesis explanation of the shape of the yield curve, investors will expect future rates to be higher; hence, floating rates are expected to rise. This would suggest that the swap spread will narrow. The opposite happens if the yield curve inverts.
Supply and Demand
The swap spread is influenced greatly by supply and demand for swaps. For example, greater-volume cash market instruments drive up a need for hedging instruments, which will widen swap spreads. The best example of this is corporate bond issuance; as volumes increase, the need for underwriters to hedge their bond holdings increases. Greater bond issuance also has another impact, as issuers seek to swap their fixed-rate liabilities to floating-rate. This also increases demand for swaps.
Market Volatility
Swap spreads widen during times of market volatility. This may be in times of market uncertainty (e.g., the future direction of base rates or possible inversion of the yield curve) or in times of market shock such as 9/11. In some respects, widening during periods of volatility reflects the perception of increased bank default risk. It also reflects the "flight to quality" that occurs during times of volatility or market correction: This is the increased demand for risk-free assets such as government bonds that drives their yields lower and hence swap spreads wider.
Government Borrowing
The level of government borrowing influences government bond yields, so perforce will also impact swap spreads. If borrowing is viewed as being in danger of getting out of control, or the government runs persistently large budge deficits, government bond yields will rise. All else being equal, this will lead to narrowing swap spreads.
We can see then that a number of factors influence swap spreads. An ALM or Treasury desk should be aware of these and assess them because the swap rate represents a key funding and hedging rate for a bank.
From an introductory reading of financial economics, we know that a positively sloping yield curve is to be expected under transparent, liquid market conditions. A combination of the expectations hypothesis, the liquidity premium and the inflation premium explains why this is so; longer-dated assets yield a higher return than shorter-dated assets. Thus, in most circumstances, we expect the one-month rate to be higher than the one-week rate, and the three-month rate to be higher than both the one-week and the one-month rates. This is confirmed at Figure 46.4, which shows the LIBOR curves for U.S. dollar and sterling (GBP) on May 25, 2006.
We expect that the rate on a longer term will be higher than that on a shorter term, unless we have an inverted yield curve. This is because under most circumstances lenders demand a higher return for longer-dated loans as compensation for the increased inflation and credit risk exposure of longer-dated assets. But what should be the magnitude of this term premium? By how much more should a three-month deposit pay compared to a one-month deposit?
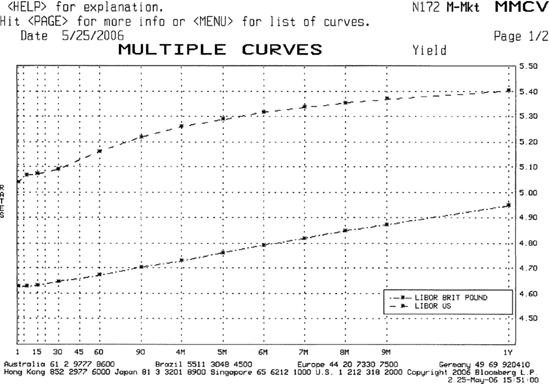
Figure 46.4. USD and GBP Money Market Yield Curves on Bloomberg, May 25, 2006 Source: © Bloomberg L.P Reproduced with permission. All rights reserved. Visit www.bloomberg.com http://www.bloomberg.com
The answer to this question is not fixed and is a function of a number of factors. In a developed economy that is not subject to high inflation, the most important of these factors is probably future interest rate expectations. If we allow for this factor, we can conclude that a reasonable term premium under "normal" market conditions for the three-month rate compared to the central bank base rate is in the order of between 12 and 20 basis points. We choose the three-month rate because it is traded on a liquid futures contract (the Eurodollar and short-sterling contracts for USD and GBP, respectively) and so we can analyze the market's forward rate expectations for this tenor deposit. But the basic principles will apply to any maturity. Of course, there is no such thing as a "normal" market condition; the term premium will fluctuate daily and always reflect the interaction of a number of factors.
On May 25,2005, we observed the following rates for U.S. dollar:
| Fed funds rate (overnight) 3.00% |
| Three-month LIBOR fix 3.31% |
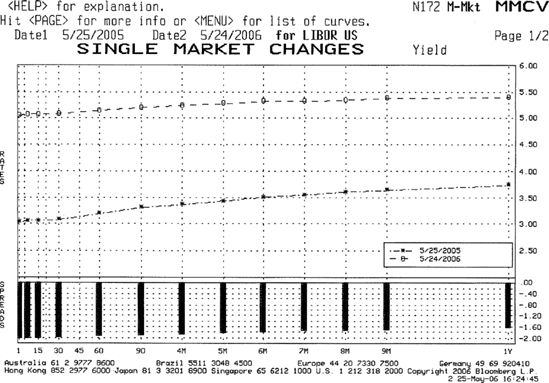
Figure 46.5. Positively Sloping USD Money Market Yield Curves: May 24, 2005 and May 25, 2006 Source: © Bloomberg L.P Reproduced with permission. All rights reserved. Visit www.bloomberg.com http://www.bloomberg.com
The three-month rate is 31 basis points above the overnight rate.
The same rates for pounds sterling are:
| Bank of England base rate 4.75% |
| Three-month LIBOR fix 4.87% |
| The three-month rate here is at a much lower spread, only 12 basis points. |
| Fast-forwarding one year later to May 25, 2006, we observe the following rates: |
| Fed funds rate (overnight) 5.00% |
| Three-month LIBOR fix 5.22% |
| Bank of England base rate 4.50% |
| Three-month LIBOR fix 4.705% |
The spreads here are 22 basis points for the U.S. dollar and 20.5 basis points for sterling.
We need to look at market expectations for an explanation of these term premiums. In May 2005, the market was expecting a continuation of the gradual, "measured" interest raises (the Federal Reserve's own term to describe its rate-setting policy), in clips of 25 basis points, at each meeting of the Federal Reserve. (The Federal Reserve's Open Market Committee [FOMC], which sets the USD base rate, meets every six weeks or so.) This is reflected in the positively sloping yield curve for USD money markets, as shown in Figure 46.5. This is confirmed in Figure 46.6, a graph of the Fed Funds rate for the period May 2005-May 2006, which shows that the rate was moved upward by 25 basis points at every Fed meeting up until the May 10, 2006, meeting, when the rate was raised to 5.00%. Lenders will require a premium to reflect the expectations of higher interest rates; hence, the three-month term premium in May 2005 was 31 basis points. Figure 46.7 shows the USD three-month LIBOR rate history for the same period.
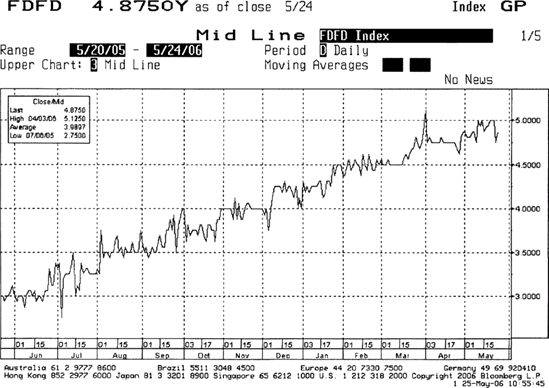
Figure 46.6. Fed Funds Rate for May 2005-May 2006 Source: © Bloomberg L.P. Reproduced with permission. All rights reserved. Visit www.bloomberg.com http://www.bloomberg.com
Contrast the situation with pound sterling. In May 2005, the prevailing market sentiment was that the next move in base rates would be downward. This is shown in Figure 46.8, which shows that the money market yield curve for May 25, 2005, was inverted.
Note that the curve slopes gently upward before then inverting, implying that the market expected the cut in rates to be in a period more than three months from now. However, the term premium was only 12 basis points, reflecting the negative curve. Figures 46.9 and 46.10 show the rate histories for the Bank of England base rate and GBP three-month LIBOR.
So we see that the term premium reflects the market expectations of future rates, and in an environment where the expectations are for higher rates, the premium will be higher. The opposite applies where the expectation is for lower base rates.
This begs the question, "What should the term premium be in a 'neutral' interest rate environment? That is, what should a lender demand for term funds lent out when the market does not expect rates to be stable over the next 12 months and not move up or down?
We can look at the 90-day money futures contracts for an idea of when this is the case. In May 2006, the outlook for base rates in USD and GBP was fairly stable. In the United States, the consensus was that rates would either top out at 5.00% or be raised one more time to 5.25% at the June 29, 2006, FOMC meeting. This is shown by the Eurodollar curve, which gives us the market expectations for forward three-month deposit rates. Figure 46.11 shows the Eurodollar curve on May 25, 2006. Figure 46.12 shows the LIBOR fix for the same day.
We see that the curve is essentially flat. The market expectations for 90-day money range from 5.275% in June 2006 to 5.235% in June 2007. This implies that fair value in a stable rate environment is roughly 22 basis points for U.S. dollars.
The scenario in the United Kingdom is slightly different. Figure 46.13, the short-sterling curve for May 25,2006, shows an expectation of rising base rates in the following 12 months. We see that the expected 90-day LIBOR fix for June 2006 is 4.72%, compared to 5.070% for June 2007. In the case of sterling, there is possibly greater uncertainty compared to the United States, which was approaching the end of an obvious rising rates cycle. In the United Kingdom, only a few months previously there was commentary that the next move in rates would be down (rates had been stable since the cut to 4.50% in August 2005). This uncertainty is perhaps reflected in the term premium of 20.5 basis points—we suggest that a greater level of certainty (of the next move being a rise in rates) would have translated into a greater term premium, as we saw with USD in May 2005. Notice also how the rest of the curve is very flay after that—the June 2008 forward rate is 5.14%, a difference of only 7 basis points from the rate implied by the June 2007 contract. This is not really meaningful since rate changes are usually effected in 25-basis-point clips. In fact, it reflects the lack of market consensus on the timing and magnitude of the next base rate move.
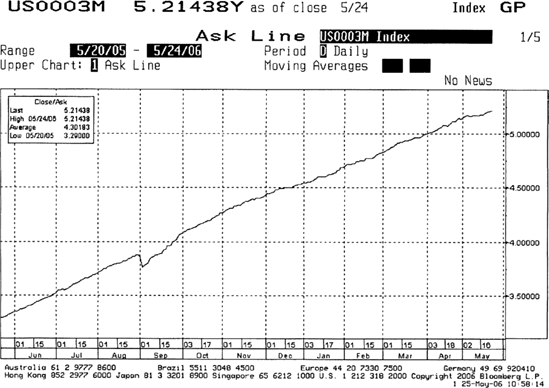
Figure 46.7. GBP Money Market Curves, 2005-2006 Source: © Bloomberg L.P. Reproduced with permission. All rights reserved. Visit www.bloomberg.com http://www.bloomberg.com
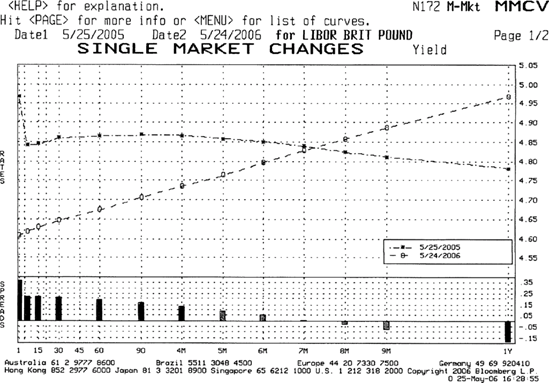
Figure 46.8. USD Three-Month LIBOR Rate for May 2005-May 2006 Source: © Bloomberg L.P. Reproduced with permission. All rights reserved. Visit www.bloomberg.com http://www.bloomberg.com
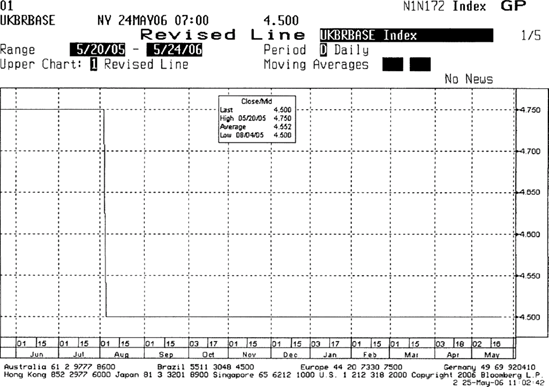
Figure 46.9. GBP Base Rate History, May 2005-May 2006 Source: © Bloomberg L.P. Reproduced with permission. All rights reserved. Visit www.bloomberg.com http://www.bloomberg.com
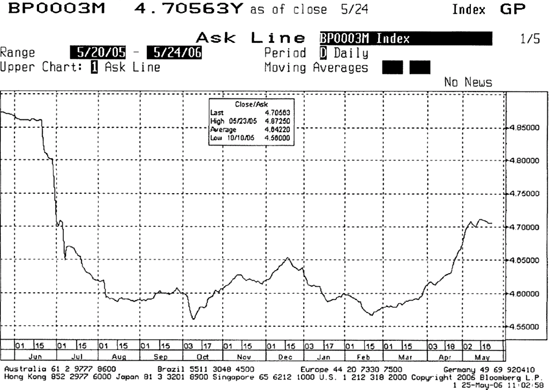
Figure 46.10. GBP Three-Month LIBOR History May 2005-May 2006 Source: © Bloomberg L.P. Reproduced with permission. All rights reserved. Visit www.bloomberg.com http://www.bloomberg.com
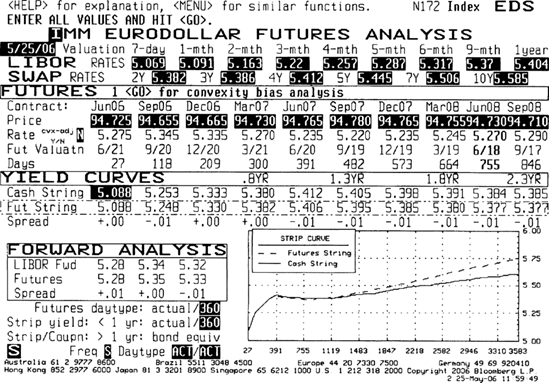
Figure 46.11. Eurodollar Futures Curve on May 25, 2006 Source: © Bloomberg L.P. Reproduced with permission. All rights reserved. Visit www.bloomberg.com http://www.bloomberg.com
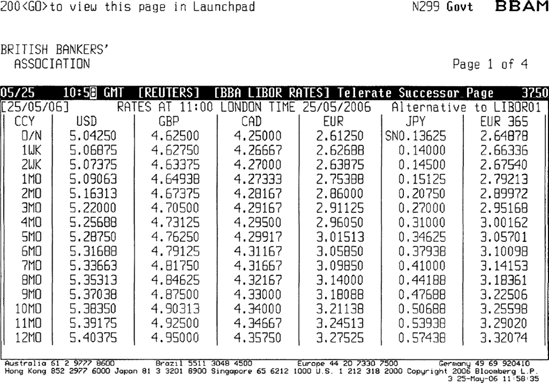
Figure 46.12. BBAM LIBOR Fixing on May 25, 2006 Source: © Bloomberg L.P. Reproduced with permission. All rights reserved. Visit www.bloomberg.com http://www.bloomberg.com
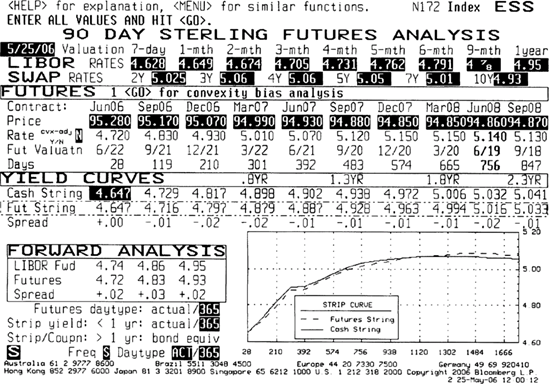
Figure 46.13. Short Sterling Futures Curve, May 25, 2006 Source: © Bloomberg L.P. Reproduced with permission. All rights reserved. Visit www.bloomberg.com http://www.bloomberg.com
In a stable interest rate environment, then, we would suggest that the 90-day term premium would be between 15 and 20 basis points. This can be considered fair value. Considering the forward rates implied in Figures 46.11 and 46.13, if we had a firm view in either direction, we would trade the contracts to reflect this. If we expect the base rate to be different at the time of the futures contract expiry, in our analysis we should logically build in a term premium to reflect this expected base rate, together with any further rate move expectations that we ourselves have.
Banks are an important part of the global economic system, if not the most important part. It goes without saying, therefore, that efficient management of a bank's assets and liabilities feeds directly into overall economic development and national well-being. The treasury or ALM desk of a bank must perforce have a keen understanding of macro-level economic factors and the overall geopolitical situation because this drives swap spreads and the term premium. It is worth considering the impact of these factors, in general terms, on spreads and the overall level of interest rates because the ALM desk will need to take them into account as part of its strategy. Also, geopolitical events often arrive unannounced. An ability to work effectively under the circumstances prevailing in such occurrences is crucial to efficient ALM.
Events that impact the financial markets at a macro level are often termed "market shocks" or "external geopolitical events." Such events invariably result in higher market volatility. The immediate impact of this is a market sell-off and a "flight to quality," which is when investors move out of higher-risk assets such as equities and emerging-market sovereign bonds and into risk-free assets such as U.S. Treasuries and U.K. gilts. This is an almost knee-jerk reaction as investors instantly become more risk averse.
Swap spreads, which we define as the spread between the fixed-rate paid on an interest-rate swap over the yield of the government bond of similar maturity, reflect the market perception about the general health of the economy and its future prospects, as well as the overall macro-level geopolitical situation. Because the swap curve is an indicator of interbank credit quality, the swap spread can be taken to be the market perception of the health and prospects of the interbank market specifically and the bank sector generally.
Speaking generally, swap spreads widen during periods of increased market volatility. By implication, a flight-to-quality should be reflected in a widening of the spread. This is expected because investors' new risk aversion manifests itself in lower government bond yields, arising from higher demand for government bonds. However, on occasion, this analysis might be overly simplistic because other micro-level factors will still be in play and can be expected to influence market rates. How can we consider the interaction between government yields, swap rates, and possible influences on the swap spread?
Table 46.1. Correlation between the USD 10-Year Swap Spread and the CBOE VIX Index and the 10-Year U.S. Treasury Yield and the CBOE VIX Index
Correlation between VIX and 10-Year Swap Spread | Correlation between VIX and 10-Year U.S. Treasury Yield | |
|---|---|---|
Source: HBOS. Reproduced with permission. | ||
Asian currency crisis (1997-1998) | 0.71 | −0.52 |
Long-Term Capital Management and Russian debt default (June-September 1998) | 0.90 | −0.78 |
9/11 to Afghan war (September 2001-March 2002) | −0.17 | −0.67 |
Iraq War (March-May 2003) | 0.54 | −0.08 |
Ford and GM credit rating downgrade (March-May 2005) | 0.38 | −0.53 |
The research team at HBOS (2006) produced a report that suggests a novel way for us to analyze this, and we summarize the findings of that study. We require an indicator of market volatility; one measure of this for the U.S. dollar market is the VIX index. The VIX index is produced by the Chicago Board Options Exchange (CBOE) and is a proxy measure of market volatility. It uses a weighted average of implied volatilities to calculate an estimate of future volatility. An increase in the level of the index indicates increased market volatility.
We illustrate the relationship between geopolitical events and the magnitude of the swap spread by looking at the correlation between the U.S. dollar 10-year swap spread and the VIX index. Table 46.1 shows—as expected—a positive correlation between the VIX index and the swap spread during a period of both economic events and macro-level geopolitical events. For instance the period covers the 9/11 events as well as the Ford and GM credit rating downgrades of 2005. There is a notable exception for the period September 2001 to March 2002, when there is a negative correlation. This is our first indication that the relationship is not as simplistic as we might think. Although the geopolitical situation was negative, with the events of 9/11 leading to the U.S. war in Afghanistan, suggesting that swap spreads should widen, this was also a period of successive cuts in the U.S. base interest rate (the "Fed rate"). During this time, the swap rate fell by more than 100 basis points as the Fed rate was cut by 175 basis points. So, here, we observe that the impact of specific financial market factors was greater than macro-level geopolitical issues. Generally, though, we observe the strong positive correlation between the swap spread the volatility index.
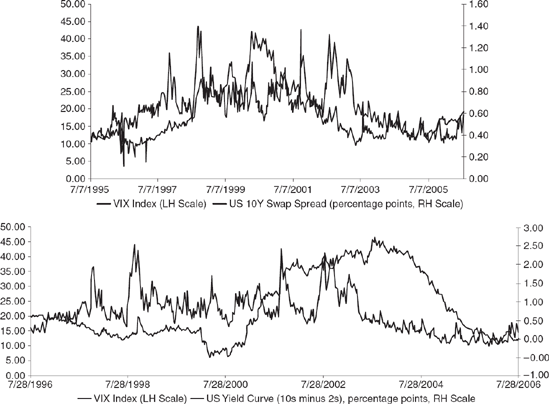
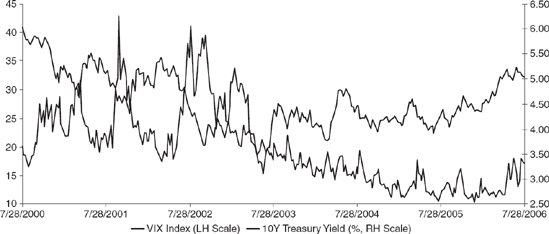
Figure 46.14 is a chart of the spread to the level of the VIX index.
By the same analysis, we can expect a negative correlation between the U.S. Treasury yield and the VIX index level. This is generally borne out in Table 46.15. However, as with the case of the swap spread correlation, we see an occasion when other factors impact the correlation value. The low negative value for the period in 2003 leading up to and after the second Iraq war shows other factors influencing the Treasury yield. Miller and Chester (2006) of the Halifax Bank of Scotland (HBOS) report that the flight-to-quality had taken place before the war actually began and was fully priced-in to Treasury yields.
Figure 46.15 illustrates the lower government bond yields that are observed at times of higher market volatility
The purpose of the foregoing has been to illustrate how the swap spread interacts with macro-level geopolitical factors. However, even during periods of high market tension, characterized by high levels of market volatility, the swap spread will respond also to more micro-level financial factors. Practitioners need to be aware of the nature of this interaction and allow for this in their ALM strategy, planning, and risk hedging.
Interest rate swaps are important tools for use in bank asset-liability management, risk management, and interest rate risk hedging. The swap curve lies above the sovereign benchmark yield curve, this yield difference representing the risk premium of the interbank market compared to the sovereign market. The factors that drive the magnitude this premium are varied and include macro-level political and economic issues, level and slope of the yield curve, supply and demand, market volatility, and the level of government borrowing.
The shape of the short-term yield curve reflects a term premium. The level of this term premium varies with the current shape of the curve and market expectations of future interest rates. We can use the 90-day futures curve to infer market rate expectations, and use this to estimate what the term premium will be for future term borrowings.
Burghardt, G. (2003). The Eurodollar Futures and Options Handbook. New York: McGraw-Hill.
Fabozzi, F. J., Mann, S. V, and Choudhry, M. (2002). The Global Money Markets. Hoboken, NJ: John Wiley & Sons.
Ludwig, N. (1993). Understanding Interest Rate Swaps. New York: McGraw Hill.
Miller, M., and Chester, A. (2006). Geo-politics returns to the limelight. Economics Perspectives, August 8, HBOS Treasury Services.