
P. BRETT HAMMOND, PhD
Managing Director and Chief Investment Strategist, TIAA-CREF Asset Management
Abstract: In many regimes, inflation is arguably the largest systematic bond risk factor. As such, inflation-linked bonds are as close as the market has gotten to the riskless asset, the ultimate real return investment. The issuer market is dominated by sovereign entities willing to take on inflation risk to reduce interest payments, manage the economy, and match certain payments to cash flows. They are used by long and short-term investors interested in inflation hedging, managing risk, consumption smoothing, asset allocation, and as a basis for inflation-linked derivatives. The basic structure of inflation-linked bonds is unique in that it pays a return equal to actual accrued inflation plus a real interest rate. Consequently, an inflation bond responds uniquely to market and other forces such as economic growth, expected inflation, interest rates and taxes. Investors should therefore consider the effect of such forces on the behavior of an inflation bond's return, current yield, volatility, duration, beta, term structure, and other factors. These factors suggest uses for inflation-linked bonds in liability matching, diversified portfolios, and inflation "trading."
Keywords: inflation, inflation expectations, breakeven inflation, inflation-linked bonds, nominal bonds, inflation risk premium, real interest rate, real return, triple duration, volatility, riskless asset, inflation indexation, consumer price index (CPI-U), Treasury inflation-protected securities (TIPS), linkers, consumption
U.S. inflation-linked securities were first issued in 1997. Originally called Treasury inflation-indexed securities (TIIS), they are now commonly referred to as Treasury inflationprotected securities (TIPS). Other nicknames for inflation-linked bonds include linkers (United Kingdom), real return bonds (Canada), inflation-protected bonds, inflation-indexed bonds, and inflation bonds.
When they were first introduced in early 1997, it was not clear that TIPS would become a permanent fixture. Despite the existence of inflation-linked bonds in the United Kingdom and other countries, the new U.S. TIPS were thought by many observers to be experimental. Most primary U.S. Treasury dealers and many others expressed indifference or even antipathy toward TIPS. And it wasn't until 2004 that the U.S. Treasury clearly indicated that inflation-linked bonds were on its agenda for continued issuance. Perhaps it was not apparent to many investors exactly what inflation-linked bonds were, how they would trade, and for what purposes they would be used.
The modern inflation-linked bond market didn't start with TIPS. These bonds began to appear in the latter half the twentieth century, when Finland, followed later by Israel, Iceland, and other countries, issued inflation-linked bond-like securities in response to post-World War II inflation. (It is puzzling that inflation securities were not introduced or discussed more in Germany and other countries experiencing post-World War I hyperinflation or that Lord John Maynard Keynes did not discuss the idea in light of his work on interwar economic developments.) Then, beginning in the late 1950s, economists such as Milton Friedman, Paul Samuelson, and many others endorsed the idea of creating inflation-linked government securities. In 1981, the United Kingdom first issued "linkers," their version of inflation-linked sovereign bonds, followed by Australia, New Zealand, Canada, and other developed nations.
Since 1997, U.S. and global inflation-linked bond issuance, ownership, and understanding have deepened and broadened. As of 2007, 22 countries issued sovereign inflation-linked bonds. (Germany remained the only member of the G7 not to do so.) TIPS represent roughly 8% of the total tradable U.S. government securities market and in the United Kingdom, "linkers" are roughly 20% of the total sovereign bond market. Figure 67.1 shows that the size of the sovereign global inflation-linked bond market at the beginning of 2007 was over $1 trillion, with the U.S. representing about $400 billion of that total (Barclays Capital, 2007). In the United Kingdom, over 50 agencies and private firms have also issued inflation-linked bonds, while in the Eurozone there are about 10 such issues, with a combined total value of approximately $50 billion. Between 2002 and 2007, the global inflation-linked bond market grew by an average of 30% per year. Also, as inflation-linked strips and derivatives markets emerged, conceptual and practical experience with the behavior of inflation-linked bonds increased as well.
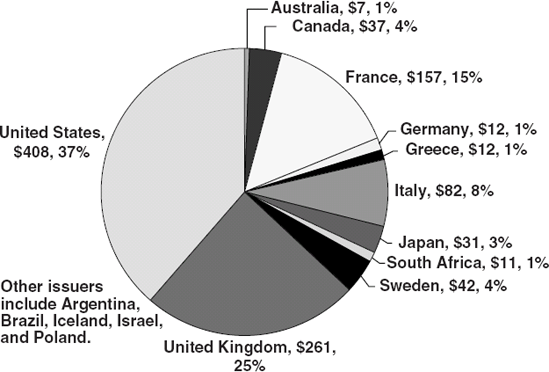
Figure 67.1. Global Sovereign Inflation-Indexed Bond Issuance Total = US$1.06 Trillion. Source: Barclays Global.
This chapter develops a basic understanding of inflation-linked bonds, including their structure, pricing, and common uses. It focuses on some of the key distinctions that set inflation-linked bonds apart from other asset classes, particularly nominal bonds. Its basic argument is that, in concept, inflation-linked bonds are not only a separate asset class, they are as close as the market has ever come to the risk-free asset, with the practical limitation that they are not as readily available as nominal "risk-free" alternatives. We will also discuss some other not-so-obvious practical characteristics of inflation bonds as the risk-free asset, such as the inflation risk premium and the triple duration.
Inflation is arguably the most fundamental systematic investment risk. Inflation poses a significant challenge in the effort to smooth consumption over time or preserve the value of an asset as it moves into the future.
In economic theory, consumers do or should smooth real consumption over time. As such, inflation introduces a discount factor as well as more uncertainty about the relationship between income and consumption. In other words, inflation is a major component of the discount rate and net present value. Interestingly, this issue has been around at least since the Roman Empire, where at one point soldiers' pay was regularly adjusted to the cost of food staples. And in the early nineteenth century some states paid Revolutionary War pensions according to the changing price of corn and hogs (see Shiller, 2003).
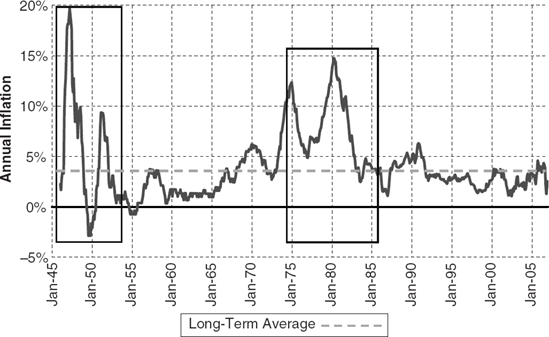
Figure 67.2 shows the long-term trends and short-term spikes in U.S. inflation since wartime price controls were removed at the end of 1945. At one level, inflation directly determines the half-life of asset value and purchasing power. For example, at the long-term U.S. inflation rate of 3% (dotted line), the purchasing power of money (or real value of an asset with zero return) drops by over 50% in 28 years. Even at the 2% inflation rate target used by many central banks, real asset value drops by more than half in 39 years. As such, it is easy to see how inflation is intimately connected to the vast literature on the time value of money and fixed income investing (see Homer and Leibowitz, 2004; and Fabozzi, 2005).
In addition, inflation can also be volatile, and a short-term inflationary shock can reduce real purchasing power and asset values quickly. As such, it is easy to see that inflation's long- and short-term behavior reduces the ability of an investor to anticipate or achieve an expected return through time. In the absence of inflation, an investor interested in evaluating an investment opportunity will still require a basic, or real, return to compensate for the opportunity cost associated with other foregone investments. The presence of inflation both increases the required compensation in order to preserve the real return and it introduces more uncertainty about what that total return (basic or real return plus expected inflation) will be.
Following this logic, a systematic approach to investment, consumption, and inflation appeared in the 1920s with the well-known Fisher equation, which decomposed a nominal bond's return into components:
where current nominal return or yield (rn%) is composed of two components: the expected (or required) real return or yield (rr%) and expected inflation (π). The implication of the Fisher equation is that ex ante, a nominal bond's return is not associated with actual inflation, but rather what investors believe inflation will be over the life of the investment. In other words, investors must assess whether or not realized inflation will equal, exceed, or trail actual inflation. If it turns out that
then the investor will be disappointed because realized higher-than-expected inflation will reduce the real, inflation-adjusted return (that is, the consumption value of the dividend stream and return of principal). If, however,
then the bond's returns will either meet expectations or exceed them, because actual inflation will be either the same or less than the ex ante estimate and the consumption value of the dividend stream and return of principal will rise. Of course, in this buy-and-hold example, the bond's nominal return will be the same in both of these inflation regimes.
Instead of this static, buy-and-hold view, when we look at this bond more dynamically with daily pricing and yields, we see the familiar relationship between prices, interest rates and inflation. If interest rates (real interest rate and/or inflation rate) rise, then current bondholders are likely to experience a drop in the bond's market price. However, if rates fall, then current bondholders could experience a welcome price rise.
The static and dynamic descriptions of fixed income assets, real rates, and inflation are familiar, but incomplete. What they leave out is the uncertainty associated with inflation. While a bond's return is fixed in nominal terms over the life of the asset and thus reflects what investors think inflation will be, as we have seen an inflation surprise, up or down, will change its marked-to-market value. And while bondholders might be happy with a positive surprise (lower-than-expected inflation), they are surely averse to a negative surprise. We need to modify the classic Fisher equation to account for inflation uncertainty:
where p is the inflation risk premium an investor requires in order to compensate for the extra uncertainty associated with future inflation rates. So a nominal bond's return is really composed of three terms, a real interest rate, expected inflation, and an inflation uncertainty (risk) premium.
So what does an inflation-linked bond do that a nominal bond doesn't? We can begin to see this by looking at the return or yield components of an inflation-linked bond:
Table 67.1. Effect on Existing Bond Prices of Changes in ...
GDP Growth Rate | Real Interest Rates | Inflation Expectations | Cash Flows | |||||
|---|---|---|---|---|---|---|---|---|
Rise | Fall | Rise | Fall | Rise | Fall | Rise | Fall | |
Inflation Bond | - | + | - | + | + | - | + | - |
Nominal Bond | - | + | - | + | - | + | + | - |
One key difference between ri% in equation (67.5) and rn% in equation (67.4) is that in (67.5) the right-hand term reflects actual or realized inflation instead of expected inflation, as in (67.4). An inflation-linked bond guarantees to return an amount equivalent to actual inflation as well as a real interest rate. A second difference is that an inflation-linked bond's total return does not include the inflation risk premium component for inflation uncertainty since there is no uncertainty about whether the return will match inflation, at least in a static, buy-and-hold setting.
With daily market pricing, the effects are also different. In Table 67.1 we see that changes in the GDP, real rates, and cash flows affect nominal and inflation-linked sovereign bond prices similarly. However, unanticipated changes in inflation will have opposing effects on nominal and inflation-linked bond prices. With an inflationary surprise, nominal bond prices will fall as investors realize that their future cash flows will be worth less than they had earlier expected. In contrast, inflation-linked bond prices should rise as investors demand an asset whose cash flows preserve purchasing power and asset value in response to an inflationary surprise.
The practical structure of an inflation bond follows from this simple theory. Most (nonzero) nominal bonds are structured to pay a dividend twice a year by applying an interest rate set by the market at auction, with a return of original principal at maturity. For the Canadian-style inflation-linked bond structure, which has been adopted by almost all countries, a real coupon rate is set at auction. (At the end of 2004, the United Kingdom became the last country to switch to the Canadian structure.) Then, the principal is readjusted to reflect changes in the country's selected retail or consumer price index (CPI-U) lagged by three months. Twice a year the real coupon rate is applied to the adjusted principal in order to produce the current coupon payment. The principal and coupon payment can adjust upward as well as downward in response to consumer price index changes during the life of the bond, except that at maturity a principal amount that is "underwater " must be reset to the original par amount.
To calculate an inflation-linked bond's current price and yield, most countries use a reference index. In the United States the index for the first of the month is based on the value of the CPI-U index three months previous (for June 1 price, use the CPI-U index value for March). Since the CPI-U is a monthly index, for prices on other days, the index calculation is linearly interpolated. (There are slight variations in reference formulas used by some countries, but all follow this basic approach.)
Inflation-linked bond carry is another structural feature. For a nominal bond, carry is defined as the difference between the bond's current yield and the cost of funding the same bond in the repo market. Forward yield is the level at which the bond's value and funding costs are the same. For an inflation-linked bond, the carry is calculated using the bond's real yield and the inflation accrual. One implication of this structure is that while the inflation accrual within any one month is smooth and linear, the use of a monthly price index can make the current yield volatile from month to month. A second implication is that the lag in inflation accrual means that some inflation information is not contained within the yield (between two and six weeks, depending on the day) so that a forward real yield to the last day of inflation accretion may be superior estimate of the bond's actual value. The difference between spot and forward yields can sometimes be quite large, especially when incremental price index changes are extreme and with shorter maturities.
Inflation-linked bonds' structure and purpose can make them attractive for borrowers as well as lenders in terms of gauging inflation expectations as well as managing inflation, liabilities, risk diversification, and active trading opportunities.
The yield difference between similar nominal and inflation-linked bonds, known as break-even inflation, can be used as a gauge of inflation expectations. Formally, break-even inflation is known as
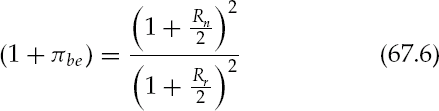
where πbe% is breakeven inflation rate between a nominal and inflation-linked bond with semiannual coupon payments. In practice, this formal approach is usually truncated as simply
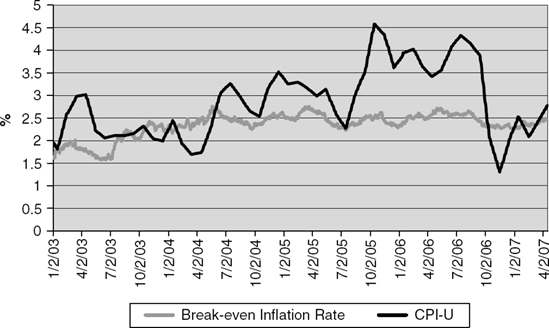
Figure 67.3. U.S. Inflation and Break-Even Inflation Rate for Constant-Maturity 10-Year U.S. TIPS. Source: Author's calculations based on TIPS yield, T-bond yield, and CPI-U.
or the current nominal yield minus the real yield. Of course, in theory, the market should anticipate inflation over the full life of the bond, since the current yield to maturity should take into account all future cash flows.
Figure 67.3 shows the break-even inflation rate and actual inflation beginning in 2003 for a constant 10-year maturity TIPS series versus a similar nominal Treasury bond series, as well as realized inflation (CPI-U). In this figure, the CPI-U is lagged by 15 days to correspond to the Bureau of Labor Statistics' inflation announcement date each month. Although the break-even rate is indicative of the market's view of longer-term inflation, it is still instructive to compare it with contemporary inflation. Central banks, such as the U.S. Federal Reserve, other government agencies, and investors use the break-even rate to gauge inflation sentiment, as a check on contemplated monetary policy changes, and to sense whether inflation-linked bonds seem expensive or cheap relative to nominal bonds.
As the proportion of an issuer's total debt issued in inflation-linked securities rises, incentives increase for the issuer to control inflation so as to limit dividend increases associated with inflation adjustments. The effects may be both real (set low inflation targets) and perceptual (increased credibility for the issuer). Increased inflation-linked issuance during an inflationary spike can also reflect a bet by the issuer that it can reduce inflation faster than inflation expectations can fall. For example, the United Kingdom made this bet at the height of stagflation in 1981 and successfully reduced its nominal interest payments over the next few years as inflation moderated.
Governments and some other entities can experience revenue and expenditure streams that are highly inflation dependent. Income tax revenues, for example, are correlated with inflation, as are transportation tolls. Inflation-linked bonds enable changes in revenues to be more directly linked to debt service. On the buy side, these bonds are the ultimate inflation immunizer. As such, inflation-linked bonds are particularly useful in pension plans where liabilities are determined, in part, by future salaries and benefit cost-of-living increases. As a result of regulatory pressure to improve asset-liability matching, many U.K. pension managers, who face partial or full inflation-adjusted benefit promises, have become large long-term holders of U.K. linkers. In the United States, pressure to improve pension liability matching is more recent and benefits are less frequently indexed to cost of living. Consequently, U.S. pensions are less interested in TIPS as part of an immunization strategy.
For both borrowers and lenders, inflation-linked bonds are portfolio diversifiers. Since the basic structure of these bonds differs from that of nominal bonds, their return behavior also differs from that of other assets (see the section on the behavior of inflation-linked bonds later in this chapter). So investors and issuers alike can benefit from the diversification benefits. For issuers, the presence of inflation-linked bonds may also be a source of a different kind of diversity by attracting new types of purchasers who are less interested in nominal bonds and more interested in longer-term, inflation-sensitive holdings. On the lender side, foreign governments and banks, especially those in Asia that are heavily exposed to U.S. fixed income markets, have been active buyers of TIPS as they manage their international capital flows.
Institutional fixed income managers have had success with active management of portfolios containing inflation-linked bonds with or without other securities. Opportunities for active management include the use of seasonality, spots and forwards, and relative value.
Seasonality
In countries where inflation accruals are based on an index that is not seasonally adjusted, break-even inflation rates often display cyclical patterns. In the United States, break-even rates tend to rise in the first half of the year and fall in the latter half of the year (see Figure 67.3). In addition, various inflation-linked bond maturities can be affected differently by seasonality. These effects represent buying and selling opportunities, both among different inflation-linked bonds along the yield curve and breakeven inflation trades between inflation-linked bonds and other asset classes. At any time of the year, a breakeven rate that is below expected inflation can signal the time to sell inflation-linked bonds; when the rate is above expected inflation, it can be a good time to buy.
Spots and Forwards
The structural features (previously described) of the spot and forward inflation-linked bond values also provide trading opportunities. Forwards on inflation-linked bonds are highly sensitive to new inflation rate announcements, because the information arrives intermittently rather than smoothly. Further, the carry shouldn't be correlated with current monthly return, but when it is, a trader can go long or short depending on the movement. A simple way of thinking about this is that a trader can compare the forward yield and break-even inflation rate with his or her own estimate of expected inflation and whether it is priced into current and forward yields.
Relative Value
The growth of the global inflation-linked bond market provides opportunities for trading among various countries' sovereign bonds. Differences in maturities, structures, price indices, seasonality, liquidity, and macro-economic conditions, can all affect the relative value of sovereign inflation-linked bonds. And the trend in declining bid-ask spreads allows these factors to be used for active management.
Arguments against the use of inflation-linked bonds often focus on the incentives for sovereign issuers and the economy. The principal criticism is that they encourage more general inflation indexation, such as wider use of cost-of-living wage, benefit, and price adjustments. As indexation becomes ubiquitous, it could encourage a continuing wage and price spiral. Such an outcome is more likely in countries where there is already a tendency toward very high inflation and central bank control is relatively weak. But even there (Brazil, Israel), governments have successfully used new issuance of inflation-linked bonds to signal a strong intention to control inflation.
The other major objection is that inflation-linked bonds trade less frequently than nominal bonds. One analysis showed that U.K. linker and TIPS turnover was about one-half (linkers) to two-thirds (TIPS) that of similar maturity nominal bonds (Hammond, 2003), and bid-ask spreads are often somewhat higher than for nominal bonds. So traders who are familiar with nominal bond markets find that the inflation-linked market can offer fewer traditional active opportunities. As we mentioned, linkers and TIPS have attracted many purchasers because of their liability matching and foreign exchange reserve management. Because of these properties, it is not surprising that inflation-linked bond purchasers are more likely to be long-term holders than nominal bond purchasers.
Although some of the uses of inflation-linked bonds are now familiar and even obvious, there are several aspects of their behavior that are becoming much better understood as we have gained experience with these assets. These aspects include return attribution, volatility, correlation, and duration.
Figure 67.4 shows the annual return composite for a weighted index of all 12 U.S. TIPS returns. It shows that the index's total return averaged almost 6.7% from 1997 through the end of 2006 (individual years are shown from 1999 to 2006). In one year, 2001, TIPS were the best performing major asset class. Overall, long-dated TIPS provided better returns than short-dated TIPS. And TIPS in general outperformed nominal U.S. bonds over the same period (with a larger outperformance at the long end of the yield curve). This is surprising given that TIPS, at least in theory, should provide a lower return due to the greater certainty of real cash flows (the inflation risk premium).
When we look at the composition of returns in Figure 67.4, we can see the contribution of the real coupon, inflation, and price changes. Overall, the real coupon contributed about 3.25% per year to total annual return, with little variation from year to year. This figure masks a declining trend in real yields over the period from an impressive 3.4% to 3.5% for the first issues in 1997 to 1.5% to 2.5% for new issues at the end of the period. The overall inflation return for the full period was about 2.5% per year, reflecting the relatively benign inflationary environment.
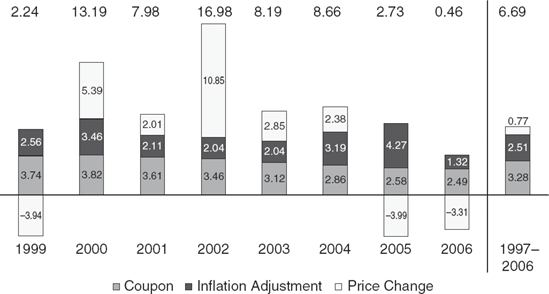
Figure 67.4. Composition of U.S. TIPS Return (Percentages Based on Monthly Returns from 3/97 through 12/06). Source: Barclays Capital.
More interesting, price returns, which as we have seen should be positively correlated with inflation surprises, in fact seem uncorrelated. As we might expect, overall price return was small, averaging less than 1% per year. But the overall figure masks considerable annual swings. When inflation rose from 1999 to 2000 and then fell slightly in 2001, price returns followed a similar but more exaggerated path. However, in 2002, when inflation remained fairly flat, price return rose dramatically to nearly 11%. And, in 2005, when inflation reached its zenith during this period, price return was decidedly negative, as it was again in 2006 when inflation hit its nadir. The explanation is that these returns weren't primarily inflation driven, since inflation remained fairly low and changes in inflation expectations were muted. Rather, a large component of price changes was changing expectations in the equity markets and the relatively limited supply of inflation-linked bonds relative to other fixed income securities. As equity markets plunged in the early years of the decade and inflation expectations rose slightly, there was a rapid flight to quality emphasizing inflation-protected instruments. As equity markets entered better years, price returns fell to negative.
Theory tells us that there should be an inflation risk premium and that it should be positive (see equation 67.4). There have been several efforts to uncover the size of the premium (Hammond, Fairbanks, and Durham, 1999b; Roll, 2004; and Campbell and Shiller, 1996). These range from a calculation that uses the simplest definition of the break-even inflation rate to produce an implied risk premium to more sophisticated analyses (Roll, 2004). Most, however, fail to show any persistent positive premium; some show that in the case of many nations' inflation-linked bonds, it has been negative. A negative risk premium implies that, instead of being willing to pay more (that is, receive a lower yield or return) for inflation protection, investors may demand a higher yield (lower price) for a new asset whose properties and continued existence are uncertain.
A somewhat more conceptual approach to understanding the inflation-risk premium starts by assuming that investors don't react rationally to inflation (Hammond, 1999b). In fact, investors are likely to be much more adverse to inflation increases than decreases, they are likely to give excess prominence to the possibility of extreme inflation, and their memory of inflation "events" fades over time. Combined with the presence of serial correlation in inflation measures, these behavioral tendencies, if true, suggest that modeling the inflation premium requires modifications to the usual expected utility models. Applying these assumptions to a model that uses a series of bootstrapped 10-year inflation-linked bond returns produces a predicted average inflation-risk premium in the range of a half of a percent, but one that varies considerably depending on the sequence and proximity of inflation patterns. In the end, even as the market gains full liquidity and depth, it is possible that the inflation risk premium's volatility will prevent issuers from fully realizing its benefits. In the interim, it is possible that investors have been receiving a somewhat greater return than they might have anticipated from the theory.
TIPS volatility is also lower than for nominal bonds. For each TIPS issue, volatility has been about one-half to two-thirds that of similar nominal bonds. For example, the annualized standard deviation of daily yields for the 2007 TIPS note from 1997 through 2005 was about 8%, while the nominal 10-year 2007 U.S. note's standard deviation over the same period was about 13% (author's calculations). Similarly, the 30-year 2028 and 2030 TIPS have had annualized standard deviations in the 7% range, while the 30-year nominal Treasury bond had an 11% standard deviation (Roll, 2004). These differences are understandable since actual inflation-related volatility ought to be factored out of the TIPS real yield.
In their 10-year history, the cross-sectional correlations among all TIPS bond returns have been high (at least 0.80 and in most cases above 0.95, based on annualized quarterly data), with the exception of a near-maturity TIPS, which behaved more like a very short-term bond. Unlike most nominal bonds, TIPS returns exhibit some serial correlation, perhaps because inflation is itself autocorrelated.
In theory, we would expect to see low or even negative correlations between inflation-linked bonds and other asset classes because of their unique response to changes in inflation and inflation expectations. As shown in Table 67.2, TIPS' correlation with nominal bonds since 1997 was highly positive (nearly 0.80) and their correlations with real estate and equities was −0.25 and −0.50, respectively (similar to nominal bond correlations). Note that the 10-year time frame may not be long enough to really gauge long-term correlations as we move through additional interest rate, inflation, and equity market cycles (e.g., TIPS and nominal bonds showed contrasting correlations with other asset classes in the 1997-2002 period). Moreover, structural supply-and-demand forces are being replaced by economic forces as the supply of TIPS increases, so we may see additional changes in relationships between TIPS and other asset classes. We should also expect to see temporal volatility in TIPS correlations. For example, because they represent the ultimate safe harbor, future market flights to quality may provide a stimulus to inflation-linked bond returns relative to nominal government securities.
If we switch from nominal to real (ex post) return measurement, the correlation between inflation-linked bonds and other assets is positive for all major asset classes, except commodities. It is also estimated that inflation-linked bonds have the shortest positive-return "holding" periods (holding period required to achieve a positive real return through the economic cycle) of any major asset class (Barclays Capital, 2006).
For nominal bonds, duration is an analytical relationship that has several useful variations (Macaulay, modified, effective). For purpose of this discussion, we will focus on the percentage change in price of a bond as a function of a unit change in nominal and real interest rates or inflation. For an inflation-linked bond, determining its duration with respect to the real interest rate is straightforward, much like calculating the nominal duration of a nominal bond. And, since both the coupon and real yield of an inflation-linked bond are lower than those for a similar-maturity nominal bond, the inflation-linked bond's real duration should be longer than the nominal bond's nominal duration.
Because inflation-linked bonds are evaluated, not just in real terms, but also in relation to nominal markets, we would also like to understand their sensitivity to changes in nominal factors, such as interest rates and inflation. And the existence of inflation-linked bonds suggests the importance of evaluating nominal bond duration with respect to real factors and inflation. We could think of this as the "triple duration" (real rate, nominal rate, and inflation duration). Leibowitz et al. (1989) first identified a "double duration" for nominal and real rates and Siegel and Warning (2004) applied that notion to inflation bonds in their analysis of pension plans. For a nominal bond, the triple duration is given as
Table 67.2. TIPS Historical Experience through 2006 (%)
Starting Date | Geometric Return | Std Dev | Correlations Inflation Bonds | U.S. Stocks | Int'l Stocks | Nom Bonds | Real Estate | T Bills | |
|---|---|---|---|---|---|---|---|---|---|
Source: Author's calculations based on annualized quarterly data from Ibbotson Associates. Notes: Returns are since starting date; correlations are from the period 12/97-12/07. U.S. inflation bonds = Lehman Bros. Global Real U.S. TIPS Index Domestic stocks = Russell 3000 Index International stocks = Morgan Stanley EAFE Index Regular bonds = Lehman Bros. Aggregate Bond Index Real estate = National Council of Real Estate Investment Fiduciaries (NCREIF) Property Index | |||||||||
U.S. inflation bonds | 1997 | 6.69 | 4.40 | 1.00 | −0.51 | −0.48 | 0.78 | −0.26 | −0.08 |
U.S. stocks | 1979 | 13.35 | 18.00 | 1.00 | 0.87 | −0.53 | 0.18 | −0.09 | |
International stocks | 1970 | 11.61 | 20.52 | 1.00 | −0.53 | 0.20 | −0.19 | ||
Nominal bonds | 1976 | 8.58 | 7.40 | 1.00 | −0.06 | 0.19 | |||
Real estate | 1978 | 10.11 | 3.65 | 1.00 | 0.35 | ||||
T bills | 1926 | 3.73 | 1.55 | 1.00 | |||||
Table 67.3. Inflation Bonds Have Triple Duration
Price Sensitivity to Changes in ... | ||||
|---|---|---|---|---|
Inflation | Real Interest Rates | Nominal Interest Rates | ||
Source: Author's calculations. | ||||
5-Year | ||||
TIPS | TII 33/8, 1/15/07 | −0.001 | 4.10 | 1.10 |
T bond | T 63/8, 2/15/07 | 3.932 | 3.91 | 3.90 |
10-Year | ||||
TIPS | TII 33/8, 1/15/12 | −0.001 | 8.02 | 3.40 |
T bond | T 47/8, 2/15/12 | 7.440 | 7.44 | 7.40 |
30-Year | ||||
TIPS | TII 37/8, 4/15/29 | −0.018 | 17.10 | 5.40 |
T bond | T 61/8, 8/15/30 | 13.306 | 13.45 | 13.30 |
where Dn% is the duration of the nominal bond with respect to the nominal interest rate, Dr% is the duration of the bond with respect to the real interest rate, and Dπ% is duration with respect to inflation.
However, an inflation-linked bond's price will not respond similarly to changes in nominal rates, real rates, and inflation rates. In addition, it isn't possible to obtain a closed-form solution for all of the elements of the triple duration. Instead, we can get a statistical picture of these relationships by looking at the actual behavior of inflation-linked bonds with respect to the critical factors. Another approach is to use the inflation-linked bond return beta with respect to nominal rates as described in Barclays Global (2006). Some readers may find this more accessible, although the results are statistically equivalent.
Table 67.3 shows the results of regressions of similar-maturity inflation-linked and nominal bonds. Of course, duration is dynamic and declines over time, so these figures are snapshots. Moreover, although they are statistically significant, they don't explain all of the variance (that is, R2 ≠ 1). Not surprisingly, nominal bonds of various maturities show nearly identical empirical duration with respect to expected inflation, implied real rates, and nominal rates. And the analytically calculated durations with respect to changes in nominal rates are close to the comparable empirically calculated durations. More important, the empirical triple durations for each inflation-linked bond can assist us in better understanding their distinctive behavior.
Looking at the first column, the empirical duration of nominal bonds with respect to inflation is, as we might expect, essentially zero (Dπ = 0). As we have seen, since inflation-linked bonds incorporate actual inflation, they should reflect current inflation (with a slight lag). Turning to the second column, with respect to real rates, inflation-linked bond durations are consistently longer than nominal bond durations, because of the inflation-linked bond's lower real coupons and yields (in that respect they behave a little more like a zero-coupon bond than a nominal bond). Finally, in the third column we see that, with respect to nominal rates, inflation-linked bond duration is considerably and consistently shorter. This reflects the fundamental difference between the two types of bonds in that nominal bonds reflect inflation expectations, for which changes flow through to affect their prices, while inflation-linked bonds reflect actual inflation, for which changes don't flow through.
Finally, by tracing the triple durations through time, we know that inflation-linked bond duration with respect to real rates descends steadily (low volatility) as maturity approaches. In contrast, inflation-linked duration with respect to real rates displays significant volatility around zero over time. Note that these are relative trends; exact calculations will vary with economic and market conditions.
One challenge to the foregoing conclusions about the triple duration is that the tax treatment of inflation-linked bonds will indeed affect their sensitivity with respected to expected inflation, as described in Roll (2004). The U.S. Internal Revenue Service treats inflation accruals to principal for TIPS as current income taxable at regular rates. So changes in inflation expectations can affect expected taxes, which in turn can affect the demand for TIPS. In contrast, for U.K. linkers and other sovereign inflation-linked bonds, inflation-related adjustments are not taxed as ordinary income and so we would not expect to see the tax effect there. Tempering the tax effect on duration in the United States is that the bulk of TIPS ownership is in tax-deferred or institutional accounts, which are insensitive to the inflation-accrual tax treatment.
With the theoretical characteristics and behavioral features of inflation-linked bonds, it is easy to assert that they are a truly new asset class that can add value to portfolios of other assets. Figure 67.5 shows efficient frontiers with and without TIPS, based on expected returns, volatility, and covariances obtained from Ibbotson Associates. Adding TIPS to a portfolio of traditional bonds and equities extends the efficient frontier and improves the risk-return characteristics conservative portfolios by largely replacing other U.S. Treasuries with TIPS.
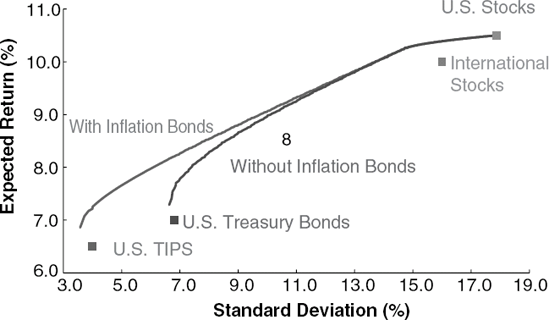
Figure 67.5. Inflation Bonds Improve Diversified Portfolios. Source: Author's calculations based on Ibbotson data.
Perhaps the most important question about asset allocation and inflation-linked bonds is the search for the risk-free asset "holy grail." In modern portfolio theory, the risk-free rate is approximated in practice with short-term (e.g., 30- or 90-day) government bills on the theory that they will quickly reflect changes in real rates and inflation and not expectations. However, in theory and—as we have seen from their behavior—in practice, inflation-linked bonds come close to being the risk-free holy grail since they remove one of the largest systematic risks affecting fixed income assets. If so, then in Figure 67.6 we would expect the efficient frontier's risk-free extension tangent line to be composed of TIPS instead of Treasury bills. The principal effect of this substitution would be to increase the nominal (and perhaps real) risk-free rate compared to Treasury bills, thereby changing the tangent point where the risk-free rate line grazes the efficient frontier. This should affect the choice of efficient portfolios of risky assets and the risk control provided by allocations to the risk-free rate.
One implication of viewing inflation-linked bonds this way is the argument that they should be used by individuals and institutions to match assets and liabilities. They can be used to "immunize" against future liabilities, since liabilities are most affected by future inflation.
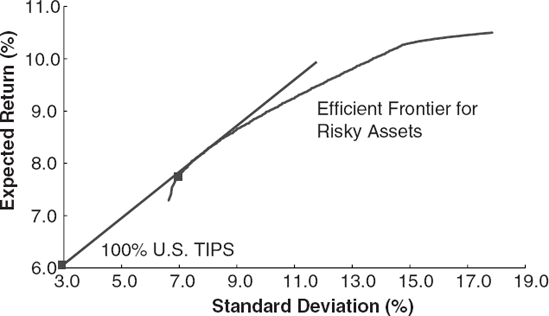
Figure 67.6. Are Inflation Bonds the "Risk-Free" Asset? Source: Author's calculations based on Ibbotson data.
Table 67.4. Defined Contribution Retirement Spending
Probability that Payments Last ... | |||
|---|---|---|---|
Until Death | Until Age 100 | Until Age 115 | |
Source: Author's calculations based on Monte Carlo simulations of asset returns (and in the case of "until death" simulations of mortality). Age = 65; annual spending = 4% of initial assets; asset allocation = 60% equities 40% bonds. | |||
Regular bonds | 0.84 | 0.61 | 0.50 |
Inflation bonds | 0.93 | 0.76 | 0.67 |
On the institutional side, for example, a defined benefit pension could use the triple-duration feature of inflation-linked bonds to provide a guarantee "floor" for benefit promises so that it takes into account both the nominal duration and the real duration of the fund. So a laddered portfolio of inflation bonds could guarantee a personal or institutional pension in real terms. Then, any assets that are held in excess of that guarantee could be invested in risky assets to provide an additional return (Bodie, 2005). The theoretical attraction of using inflation-linked bonds in this manner, however, have not been enthusiastically endorsed in practice. Although there are some signs of the use of linkers for immunization in the United Kingdom, few pension portfolios—defined benefit or defined contribution—in the United States have followed suit. Perhaps the perception of low initial yields has dampened interest.
For portfolios with significant inflation-driven liabilities, inflation-linked bonds can also be used in implementing a spending policy. As the use of defined contribution retirement plans increases, the issue of the individual spending policy is becoming increasingly visible, particularly the spend-down rate. The usual advice is for the individual to create a conservative portfolio and then draw down each year approximately 4% of initial assets. But there is a significant probability that an individual will live longer than his or her assets under this arrangement. Even with a relatively high allocation to equities, a 60% equities/40% bond portfolio (as shown in Table 67.4) has a 0.16 probability of running out before the recipient dies. Replacing the nominal bond portfolio with inflation-linked bonds increases the chances of finishing in-the-money from 0.84 to 0.93. The probability differential increases with age. However, as with portfolio immunization, the use of inflation-linked bonds for pension payout purposes is also limited at this time, perhaps again because of low initial yields.
The attributes and advantages of inflation-linked bonds, some of which were predicted and others of which have emerged since their wider introduction in the last couple of decades of the twentieth century, seem clear. However, there are a number of continuing issues that remain either unresolved or in need of clarification.
While the global sovereign inflation-linked bond market has grown, the agency and private markets have seen little issuance. With the existence of national bonds as an anchor, it might be expected that other organizations could use that anchor to issue their own bonds. This might be especially attractive for organizations whose cash flows are inflation related, including utilities, state governments, toll authorities, and retail establishments, among others. Some agencies and private organizations have indeed issued inflation-linked bonds, principally in Australia, Canada, and the United Kingdom. But the private market in the United States and elsewhere is minimal. Perhaps one explanation is that, compared to sovereign nations, no other organization or institution relies so heavily on revenue streams, such as income taxes, that are so tightly tied to inflation. Another reason may be that inflation has declined significantly over the past two decades levels. Organizations that could, in the past, raise prices in response to inflation, are faced with competitive pressures or other factors that discourage price increases. Finally, around the world, many central banks have set inflation targets and have managed monetary policy to those targets. Even in the United States, there appears to be an implicit inflation "guideline" of about 2%. So inflation-bond issuance may seem to many organizations to be irrelevant or unattractive at present. One major factor that could influence future issuance will be actual inflation. As inflation rises beyond current expectations, there may be renewed interest among a wider variety of organizations.
The agency and private organization issuance question is part of the more general question regarding the future of the inflation-linked bond market. While sovereign bond issuance continues to grow, it is apparent from yield and price movements as well as turnover that these markets, compared to nominal bond markets, are far from as deep and liquid. Large institutional trades can significantly move markets where issuance is only a fraction of the nominal bond market and a percentage of that fraction is infrequently traded. Further, the U.S. Treasury eliminated the 30-year TIPS when it ended issuance of the 30-year nominal Treasury. On the positive side, the U.S. Treasury has expressed continuing commitment to the TIPS program and has begun issuing a 20-year TIPS. Institutional investors now see inflation-linked bonds as an attractive asset class for long-term portfolios as well as short-term trading. In addition, inflation-linked swaps and other derivatives markets have emerged, along with ideas for new products. Finally, as world populations age, larger numbers of individuals will be dependent on public and private pension income that may or may not be explicitly indexed to inflation. In any event, retirees cannot rely on salary and wage increases (which are correlated with inflation) and they or their political representatives may seek additional inflation-protected solutions for retirement income. One such idea could be based on an equity-linked real bond product (Bhansali, 1998). All of these developments suggest that the market, while not exploding, is growing and should continue to grow wider and deeper over time.
Whether we count the emergence of the modern inflation-linked bond market from 1981, when the U.K. began issuing linkers; 1997, when the U.S. began issuing TIPS, or the beginning of 2007, when the global market exceeded $1 trillion, inflation-linked bond theory and practice have developed and broadened considerably. Special or unique concepts, such as the inflation risk premium, the triple duration, and the break-even inflation carry; special trading opportunities and practices; and special products, such as real-return funds and inflation-linked annuities, all represent significant advances. They also presage more to come as our understanding of these bonds and the derivatives markets and solutions based on them continue to develop.
Arnott, R. D. (2003). Editor's corner: The mystery of TIPS. Financial Analysts Journal 59, 5: 4-7.
Barclays Capital. (2006). Global Inflation-Linked Products: A User's Guide. New York: Barclays.
Barclays Capital. (2007). Linkers Monthly, January (appendix).
Bhansali, J. D. (1998a). Equity linked real bonds. Derivatives Quarterly, Fall: 1-10.
Bhansali, J. D. (1998b). "Inflation-indexed U.S. Treasury bonds: An analysis. Journal of Investing, Fall: 1-7.
Bodie, Z. (1990). "Inflation, indexed-linked bonds and asset allocation. Journal of Portfolio Management 16, 2: 48-53.
Bodie, Z. (2003). Worry-Free Investing. New York: FT Prentice Hall.
Bootle, R. (1991). Index-Linked Gilts: A Practical Investment Guide, 2nd Edition. Cambridge, UK: Woodhead-Faulkner.
Brynjolfsson, J., and Fabozzi, F. J. (eds.). (1999). Handbook of Inflation Indexed Bonds. Hoboken, NJ: John Wiley & Sons.
Campbell, J. Y, and Shiller, R. (1996). A scorecard for indexed government debt. In B. Bernanke and J. Rotem-berg (eds.), NBER Macroeconomics Annual (pp. 155-196). Cambridge, MA: National Bureau of Economic Research.
Fabozzi, F. J. (2005). Handbook of Fixed Income Securities. New York: McGraw-Hill Professional.
Hammond, P. B. (2003). Turnover of inflation-linked bonds. TIAA-CREF working paper.
Hammond, P. B. (1999a). Using inflation-indexed securities for retirement saving and income: The TIAA-CREF experience. In J. Brynjolfsson and F. J. Fabozzi (eds.), Handbook of Inflation Indexed Bonds (pp. 21-41). Hobo-ken, NJ: John Wiley & Sons.
Hammond, P. B., Fairbanks, A., and Durham, B. J. (1999b). Understanding the inflation risk premium. In J. Brynjolfsson and F. J. Fabozzi (eds), Handbook of Inflation Indexed Bonds (pp. 157-182). Hoboken, NJ: John Wiley & Sons.
Homer, S., and Leibowitz, M. L. (2004). Inside the Yield Book, 2nd Edition. Princeton, NJ: Bloomberg Press.
Jarrow, R., and Yildirim, Y. (2003). " Pricing Treasury inflation protected securities and related derivatives using an HJM model." Journal of Financial Quantitative Analysis 38, 2: 337-358.
Leibowitz, M. L., Sorensen, E. H., Arnott, R. D., and. Nicholas, N. H. (1989). A total differential approach to equity duration. Financial Analysts Journal 45, 5: 30-37.
Roll, R. R. (2004). Empirical TIPS. Financial Analysts Journal 60,1: 31-53.
Shiller, R. J. (2003). The invention of inflation-indexed bonds in early America. NBER Working Paper Series, 10183.
Siegel, L. B., and Waring, M. B. (2004). TIPS, the dual duration, and the pension plan. Financial Analysts Journal 60,5: 52-64.
Tobin, J. (1971). An essay on the principles of public debt management. Macroeconomics, Vol. 1 of Essays in Economics (pp. 378-455) New York: Markham Publishing Co.