FRANK J. FABOZZI, PhD, CFA, CPA
Professor in the Practice of Finance, Yale School of Management
ROLAND FÜSS, PhD
Professor of Finance, Union Investment Endowed Chair of Asset Management, European Business School (EBS), International University-Schloss Reichartshausen
DIETER G. KAISER, PhD
Director Alternative Investments, Feri Institutional Advisors GmbH and Research Fellow, Centre for Practical Quantitative Finance, Frankfurt School of Finance and Management
Abstract: According to the academic literature, investments in commodity markets are considered an effective way for investors to diversify traditional portfolios. The diversification benefits of commodities come from their low (and sometimes even negative) correlation with equity and bond markets, as well as from their high positive correlation with inflation. Therefore, during times of price increases, commodities as real assets can function as effective inflation hedges. Moreover, the low correlation with stocks and bonds remains even in downward-trending markets (that is, during phases when it is needed most). However, because commodities can be characterized as a heterogeneous asset class, commodity sector risk and return profiles can vary quite significantly, and may even move in opposite directions. In addition, the complexity of commodity investments can be revealed when considering the different ways investors can obtain exposure to this asset class. Commodity stocks, commodity funds, commodity futures, and futures indices all provide specific advantages and specific disadvantages.
Keywords: commodities, hedger, speculator, arbitrageur, basis trade, soft commodities, hard commodities, convenience yield, capital assets, store of value assets, consumable assets, transferable assets, natural resource companies
The twenty-first century has seen a renaissance of sorts for commodities, due to their high returns and subsequent increased demand from institutional investors such as pension funds and traditional portfolio managers. Compared to foreign exchange or equity markets, there is almost no way for central banks to intervene in commodity markets. Because the production side reacts very sluggishly to market distortions, short-term supply and demand shocks are compensated for only by price movements. These inherent asset class volatilities are the main reason many investors have historically refrained from investing in commodities, despite the valuable diversification benefits they can add to traditional security portfolios because of their low correlations with bonds and stocks.
In this chapter, we discuss the fundamentals of commodity investments by describing the market participants, the commodity subsectors, the commodity exchanges, and the different kinds of commodity investment vehicles available to investors. We subsequently investigate the risk and return characteristics of commodity futures using commodities futures indices. We then provide an empirical analysis of portfolio allocation of traditional security portfolios, explicitly including commodity futures.
Futures market participants are classified into hedgers, speculators (traders), and arbitrageurs. Commodity producers pass on the price risk that results from highly volatile and difficult to forecast commodity futures markets to speculators, and therefore pay a premium. Commodity producers have a distinct interest in hedging the price of their product in advance (a short hedge).
For example, consider the situation in the classic agricultural market. Farmers face a weather-dependent, volatile supply that is met by a relatively stable demand. Contrary to the maintenance cost for cattle breeding or the purchase cost of seed, the selling price is generally known only upon completion.
We see the opposite in the manufacturing industry: As the manufacturing industry hedges increasing commodity prices (a long hedge), the contrarian position to the commodity producers' short positions is taken. Airline companies, for example, often appear as long hedgers to guard against increasing fuel prices, the underlying in which the airline companies are short. If an existing or expected cash position is compensated for via an opposite future, the market participant is classified as a hedger. Hence, for the commodity producer, there is a fixed net profit; for the commodity manufacturer, there is a fixed purchase price.
Speculators represent the largest group in the futures markets. Their main task is to provide liquidity on the one hand, while balancing the long and short hedges on the other hand. Contrary to the commodity producers or the manufacturing industry, which try to avoid susceptibility to unfavorable price developments, the intention of speculators is to take a distinct market position and speculate for a price change. To make a profit, speculators deliberately take on risk by betting on rising or falling prices. As opposed to hedging, speculation is subject to both huge gains and huge losses, since speculators do not hold compensating cash positions.
The third and smallest group of market participants are the arbitrageurs, who try to take advantage of time-or location-based price differences in commodity futures markets, or between spot and futures markets, in order to generate riskless profits. Clearly, this group also intends to make profits, but their trading activity does not involve taking risky positions. Moreover, they use economic and financial data to detect existing price differences with respect to time and location. If these price differences exceed interlocal or intertemporal transfer costs like shipping, interest rates, warehouse costs, or insurance costs at the spot market, riskless profits can be realized. Consequently, price differences among the markets are adjusted, price relationships among the markets are restored, and arbitrageurs guarantee market balancing.
In the case of cash and carry arbitrage, the resale price of today's leveraged spot position is simultaneously set by selling the commodity futures. This short futures position implies an unconditional commitment to purchase the underlying at maturity. At maturity of the futures, the specified commodities are tendered against the maturing short futures. If the profit from the spot trade of the physical commodity exceeds the value of the futures plus the cost of debt financing, the arbitrageur will realize a profit from what is known as a basis trade.
Investments in international commodity markets differ greatly from other investments in several important ways. First, commodities are real assets—primarily consumption and not investment goods. They have an intrinsic value, and provide utility by use in industrial manufacturing or in consumption. Furthermore, supply is limited because in any given period, commodities have only a limited availability. For example, renewable commodities like grains can be produced virtually without limitation. However, their yearly harvest is strictly limited. In addition, the supply of certain commodities shows a strong seasonal component. While metals can be mined almost all year, agricultural commodities like soybeans depend on the harvesting cycle.
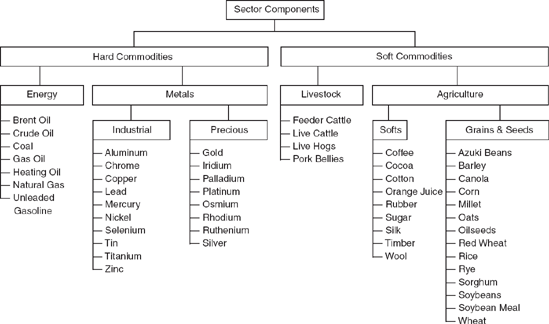
Another important aspect of commodities as an asset class is heterogeneity. The quality of commodities is not standardized; every commodity has its own specific properties. A common way to classify them is to distinguish between soft and hard commodities. Hard commodities are products from the energy, precious metals, and industrial metals sectors. Soft commodities are usually weather-dependent, perishable commodities from agricultural sector serving for consumptional purposes, such as grains, soybeans, or livestock such as cattle or hogs. Figure 57.1 shows the classification of commodity sectors.
Storability and availability (or renewability) are also important features of commodities. Since storability plays a decisive role in pricing, we distinguish between storable and nonstorable commodities. A commodity is said to have a high degree of storability if it is nonperishable and the costs of storage remain low with respect to its total value. Industrial metals such as aluminum or copper are prime examples: They fulfill both criteria to a high degree. In contrast, livestock is storable to only a limited degree, as it must be continuously fed and housed at current costs, and is only profitable in a specific phase of its lifecycle.
Commodities such as silver, gold, crude oil, and aluminum are nonrenewable. The supply of nonrenewable commodities depends on the ability of producers to mine raw material in both sufficient quantity and quality.
The availability of commodity manufacturing capacities also influences supply. For some metals (excluding precious metals) and crude oil, the discovery and exploration of new reserves of raw materials is still an important issue. For given supply, the price of nonrenewable resources depends strongly on current investor demand, while the price of renewable resources depends more on estimated future production costs. (The events following Hurricane Katrina in 2005 clearly illustrated the insufficiency of the refinery capacities for crude oil and natural gas. Declining investment in this sector over the years has led to a bottleneck. The absence of investment in the industrial metals sector is also an issue for the supply side.)
The monetary benefit from holding a commodity physically instead of being long the respective futures is called the convenience yield. The convenience yield reflects market participants' expectations regarding a possible future scarcity of a short-term nonrenewable commodity.
There is a broad consensus among academics and practitioners that commodities compared to other alternative assets can be considered—in a portfolio context—as an asset class of their own. (In reality, most alternative investments like hedge funds or private equity are not an asset class of their own, but are considered alternative investment strategies within an existing asset class.) By definition, an asset class consists of similar assets that show a homogeneous risk/return profile (a high internal correlation), and a heterogeneous risk/return profile toward other asset classes (a low external correlation). The key properties are common value drivers, and not necessarily common price patterns. This is based on the idea that a separate asset class contains a unique risk premium that cannot be replicated by combining other asset classes (see Scherer, 2005). Furthermore, it is generally required that the long-term returns and liquidity from an asset class are significant to justify an allocation.
To describe existing asset classes, Greer (1997) explains the decomposition into so-called super classes: capital assets, store of value assets, and consumable or transferable assets. Continuous performance is a characteristic of capital assets. Equity capital like stocks provides a continuous stream of dividend payments, while fixed income guarantees regular interest payments in the absence of the default of the obligor.
Common to all capital assets is that their valuation follows the net present value method by discounting expected future cash flows. In contrast, real estate as an asset class has a hybrid classification. On the one hand, real estate can be classified as a capital asset because it promises a continuous rental stream and has market value. On the other hand, some features of real estate assets can justify their classification as store of value assets (for example, if the real estate is used for the owner's own purpose). Such store of value assets cannot be consumed, nor do they generate income; classic examples are foreign exchange, art, and antiquities.
Commodities belong to the third super class— consumable or transferable (C/T) assets. In contrast to stocks and bonds, physical commodities like energy, grains, or livestock, do not generate continuous cash flows, but rather have an economic value. Grains, for example, can be consumed or used as input goods; crude oil is manufactured into a variety of products. This difference is what makes commodities a unique asset class.
Hence, it is obvious that commodity prices cannot be determined by discounting future cash flows. Thus, interest rates have only a minor influence on the value of commodities. Moreover, commodity prices are the result of the interaction between supply and demand on specific markets (see Scott, 1994). In this context, it is not surprising that the capital asset pricing model (CAPM) cannot adequately explain commodity futures returns. As we have noted, commodities are not capital assets (see Erb and Harvey, 2006; Bodie and Rosanksy, 1980).
The line between the super classes is blurred in the case of gold. On the one hand, gold as a commodity is used in such things as electrical circuitry because of its excellent conductivity. On the other hand, gold as a store of value asset is a precious metal and is used for investment, similarly to currencies. The rising demand of commodities since the stock market downturn in 2002 clearly demonstrates this characteristic. Because gold can be leased, Anson has even classified it as a capital asset. (Precious metals like gold or platinum can generate a lucrative stream of income by being leased at market leasing rates. See Anson [2006].)
Another specific criterion that differentiates commodities from capital assets is that commodities are denominated worldwide in U.S. dollars. Furthermore, the value of a specific commodity is determined through global rather than regional supply and demand. In comparison, equity markets reflect the respective economic development within a country or a region.
In general, there are several ways to participate in commodity markets via a number of different kinds of financial instruments. The most important are (1) direct investment in the physical good, (2) indirect investment in stocks of natural resource companies, (3) commodity mutual funds, (4) an investment in commodity futures, and/or (5) an investment in structured products on commodity futures indices.
First, it seems obvious to invest directly in commodities by purchasing the physical goods at the spot market. However, the immediate or within two days delivery is frequently not practical for investors. According to Geman (2005), precious metals like gold, silver, or platinum are an exception, as they do not have high current costs and do not require storage capacity. However, a portfolio consisting solely of precious metals would not be a sufficiently diversified portfolio for investors to hold.
An investment in commodity stocks (natural resource companies), which generate a majority of their profits by buying and selling physical commodities, may conceivably be considered an alternative investment strategy. In general, the term "commodity stock" cannot be clearly differentiated. It consists of listed companies that are related to commodities (that is, those that explore, mine, refine, manufacture, trade, or supply commodities to other companies). Such an indirect investment in commodities (e.g., the purchase of petrochemical stocks) is only an insufficient substitute for a direct investment. By investing in such stocks, investors do not receive direct exposure to commodities because listed natural resource companies all have their own characteristics and inherent risks, and take action in order not to be exposed too strongly to their commodity product by hedging appropriately.
Georgiev (2005) shows that these sector-specific stocks are only slightly correlated with commodity prices, and hence prices of commodity stocks do not completely reflect the performance of the underlying market. This is because stocks reflect other price-relevant factors such as the strategic position of the company, management quality, capital structure (the debt/equity ratio), the expectations and ratings of company and profit growth, risk sensitivity, as well as information transparency and information credibility. (For example, consider the poor information policy of Shell in the matter of the Brent Spar oil platform in 1995, which led to a massive stock price decline.)
Stock markets also show quick and more sensible reactions to expected developments that can impact company value. Hence, other causes of independent price discovery exist that differ from a pure commodity investment. Moreover, there may be temporary market disequilibriums, especially for stocks with low free float where few buy and sell transactions can already cause major price reactions. Finally, natural resource companies are subject to operational risk caused by human or technical failure, internal regulations, or external events. This means that when investing in a company listed on the stock exchange, both the associated market risk as well as any idiosyncratic risk must be considered carefully. Also note that the majority of large oil and energy companies hedge the risk associated with buying and selling oil products in order to smooth yearly profits.
However, the risk of commodity stocks is not completely reflected in the price volatility. First, particularly in the energy and metal sectors, there is the paradox that companies threaten their own business fundamentals by extracting exhaustible resources. On the one hand, long-term decreasing total reserves mean rising prices and a positive prospective for investors and commodity producers. On the other hand, commodity producers will suffer when resources are depleted.
Second, there is always the risk of a total loss if prices decrease below total production costs and the extraction of a commodity is stopped. By constructing an index consisting of commodity stocks, Gorton and Rouwenhorst (2006) show empirically that observed return correlations with commodity futures are even lower than those with the S&P 500. Furthermore, the commodity stock index exhibits lower historical returns than a direct commodity investment. For example, the returns of European oil companies covary strongly with EuroStoxx, but less with oil price returns. Exceptions are gold and silver stocks, whose beta to the domestic stock index is smaller than the beta to the gold and silver price.
Table 57.1. Commodity Futures Indices
Reuters/Jefferies Commodity Research Bureau (RJ/CRB) | Goldman Sachs Commodity Index (GSCI) | Dow Jones/AIG Commodity Index (DJ-AIGCI) | |
|---|---|---|---|
Introduced in | 2005 | 1991 | 1998 |
Historical data available since | 1982 | 1970 | 1991 |
# of commodities | 19 | 24 | 19 |
Weighting scheme | Within a graduated system of four groups, based on liquidity and economic relevance | Rolling 5-year average of world production | Liquidity data, in conjunction with dollar-weighted production from the past 5 years |
Rebalancing frequency | Monthly | Yearly | Yearly |
Allocation restrictions | None | None | 33% Maximum per sector; 2% market minimum per commodity |
Relevant futures price on which the index calculation is based | Next futures contract/delivery month | Next month with sufficient liquidity | Next futures contract/delivery month |
Roll period | 4 Days | 5 Days | 5 Days |
Calculation method | Arithmetic | Arithmetic | Arithmetic |
In contrast to an investment in commodity stocks, one can actively invest in commodity funds, realizing an adequate diversification benefit with moderate transaction costs. Commodity funds differ in terms of management style, allocation strategy, geographic and temporal investment horizon in the denominated currency, and investment behavior. It is also important for investors to distinguish between active and passive funds (that is, index tracking funds). Commodity stock indices (e.g., the MSCI World Materials, the FTSE World Mining, the HSBC Global Mining, the Morgan Stanley Commodity Related Index, the FTSE World Oil, and Gas or the FTSE Goldmines) and commodity futures indices can be used to benchmark actively managed commodity funds. Commodity trading advisors (CTAs) also present an alternative to actively managed investment products. Today, there are also about 450 hedge funds with energy- and commodity-related trading strategies.
Nowadays, investors can choose from an increasing number of investible commodity futures indices as a passive form of investing in commodities (see Table 57.1). Commodities have an exceptional position among alternative investments because they provide investible indices for a broad universe of commodity sectors. According to Doyle, Hill, and Jack (2007), between US $55 billion and $60 billion were invested in the Goldman Sachs Commodity Index (GSCI) in March 2007, and another US $15 billion was linked to the Dow Jones-AIG Commodity Index. Estimates for December 2006 state that about US $90 billion of invested capital from pension and mutual funds are invested in commodity-based indices or products. (In 2001, the total invested capital in the GSCI was between $4 billion and $5 billion. At the beginning of 2007, Standard & Poor's acquired the GSCI Commodity Index, which was subsequently renamed the S&P GSCI Commodity Index.) For the majority of investors, an index-oriented investment represents the most reasonable way to obtain exposure to commodities or an individual commodity sector. Such an investment can be done cost-effectively using the following two types of financial products:
Exchange-traded funds (ETFs) on commodity indices, and
Commodity index certificates closely tied to commodity indices.
Index funds have the advantage of being relatively easy to trade and reasonably priced. Another advantage of funds over certificates is the nonexisting credit risk of the issuer. Because ETFs represent special assets, investor deposits are safe even if the investment company goes bankrupt.
Certificates constitute legal obligations that can be quickly and fairly cheaply issued by banks. In the case of commodity index certificates, the issuing institution invests in futures markets and rolls the futures contracts for a fee. The term of a certificate is normally restricted to a fixed date (e.g., rainbow certificates, whose underlyings are different subindices or asset classes, or discount and bonus certificates). But there are also open-end certificates.
However, because the indices, like the commodities themselves, are denominated in U.S. dollars, investors are exposed to currency risk. Quanto certificates, discount certificates with a currency hedge, can be used to mitigate this risk.
The main disadvantage of index certificates is that they often use excess return indices as the underlying instrument. These indices do not consider all the return components, in contrast to total return indices, which may lead to lower returns during periods of high interest rates. Investing in a low performance excess return index compared to a total return index can nevertheless be an advantage because the latter bears little or no initial costs and no yearly management fees. Hence, for investors with short-term investment horizons, certificates on excess return indices with lower returns can be a smart choice during periods of low interest rates.
Another disadvantage of index-based commodity investments is that due to their construction, they can only consider short-term futures contracts. Commodity funds not linked to commodity indices, however, can freely determine their optimal term by investing directly in commodity futures contracts. And similarly to purchasing rainbow certificates on different asset classes, there is also the possibility of purchasing commodity funds that do not invest exclusively in commodity indices, but also include commodity stocks to a certain extent.
In addition to options and other derivatives, commodity products are based primarily on futures contracts. A futures contract is a mutual binding agreement between two parties to deliver or accept and pay (or undertake a cash settlement): (1) a qualitative explicitly determined underlying (in this case commodities), (2) in a certain quantity, (3) at a fixed date, and (4) at a fixed, already at conclusion of the contract determined price. Futures can be described as mutually binding, exchange-traded "unconditional" forward contracts, since the conclusion of a futures contract leads to a legally binding accomplishment in the future if there is no compensating contrary transaction. (In contrast, in the case of conditional forward contracts such as options, the option holder has no obligation to exercise his option right, and can thus abandon the option at maturity.)
Contract sizes in the commodity market are standardized. The smallest tradable unit represents a contract, and the smallest possible price change of a futures is called a tick. The value of the minimum price change is the U.S. dollar and cent-denominated tick, multiplied by the contract size (also known as the point value) of the commodity. It is common practice to deposit a margin for every futures contract. The amount is determined by the exchange, but it is usually between 2% and 10% of the contract. (However, futures commission merchants may charge higher margins than the exchanges.) However, the margin changes according to the price and volatility of the contract.
In this context, we also distinguish between the initial margin, the minimum deposit required to invest in a futures contract, and the maintenance margin, the minimum deposit required to be on account at the exchange as long as the futures position is held. If the capital deposit on the account falls to or below the value of the maintenance margin due to price variations, the broker issues a margin call to recoup the initial value of the clients' capital. If an investor does not want to increase the margin, he can also close part of or the entire position, and accept a loss. For collateral in terms of the initial margin, investors in futures receive interest income from money market interest.
Generally, for commodity futures, there are two forms of settlement: delivery of the commodity at maturity, which happens in about 2% of the cases, and closing the futures position (that is, buying or selling the same amount of contracts before maturity). Daily price limits are a specific characteristic of commodity futures markets. As noted by Edwards and Neftci (1998), they were established to allow the market to stabilize during times of extreme movements (e.g., a cooling-off phase). Hence, daily price limits, again determined by the exchange, represent the maximum possible increase or decrease of a commodity price from the settlement price of the preceding trading day. In the case of limit up (limit down), the sellers (buyers) are outnumbered by buyers (sellers) who are willing to buy (sell) at the upper (lower) price limit. At this price limit, there may still be trading activity, but it may not exceed (limit up) or fall short of (limit down) the price limit.
The following are the contract specifications published regularly by the futures exchanges:
The type and quality of the futures underlying: The type of commodity, abbreviation, and futures exchange.
The contract size: The amount and units of the underlying asset per futures contract.
Price determination: The formal notation of futures prices at the futures exchange.
Trading hours.
The tick: the minimum permissible price fluctuation.
The currency in which the futures contract is quoted.
The daily price limit.
The last trading date.
Delivery regulations (e.g., delivery month, type of settlement).
Investors in commodity futures can profit from price movements of the underlying commodity without having to fulfill the logistical or storage requirements connected with a direct purchase. However, this is possible only if the position is closed before maturity. The advantages of futures investments lie especially in the tremendous flexibility and leveraged nature of the futures position due to the low capital requirements. Thus, a shift of an existing futures position is possible at any time, even in the short term. By holding long or short positions, investors can profit from rising and falling markets. Furthermore, the futures markets are characterized by a high degree of liquidity and low transaction costs.
Despite the numerous advantages of an active investment in commodity futures, it is not always advisable for a private investor to take futures positions in such volatile commodities. Even if diversification by a large number of different futures contracts were guaranteed, the investor would still face the problem of maintaining an exposure to commodity prices without the liability of physical delivery of the underlying contract. This requires continuously closing existing futures positions and reestablishing new positions by opening more futures contracts. This is referred to as rolling of futures contracts, and it may be quite costly depending on the forward curve of the futures market. An active, indirect investment in commodities can be achieved by purchasing futures contracts and closing them prior to maturity. In order to keep an exposure to commodities, investors must buy another futures contract with a later maturity date (this is called "rolling" and must be repeated before each maturity date).
In addition, falling futures prices may constantly trigger margin calls (although margins can be withdrawn if the futures prices increase). Overall, however, compared to traditional assets, managing futures positions requires a great deal of time and effort. It is also possible to invest in commodity swaps and forwards. These instruments, however, are of minor liquidity since they are tailor-made for individual investors. Furthermore, these derivatives are not traded at the exchange, and commodity investment strategies of individual investors cannot be publicly observed.
The trading of commodity futures takes place at specialized exchanges that function as public marketplaces, where commodities are purchased and sold at a fixed price for a fixed delivery date. Commodity futures exchanges are mostly structured as membership associations, and operate for the benefit of their members. Transactions must be made as standardized futures contracts by a broker who is also a member of the exchange. Only members are allowed to trade. Membership in commodity exchanges is restricted to individuals who often act in the name of investment banks, brokers, or producers. The main task of a commodity exchange is to provide an organized marketplace with uniform rules and standardized contracts.
The first commodity exchange was founded by Japanese farmers trading rice futures contracts in Osaka. In the United States, the Chicago Board of Trade, founded in 1848, was the first institution. Even today, most commodities are still traded there. According to Geman (2005), in the United States most futures exchanges still function as open outcry trading systems, although many exchanges around the world operate on an electronic platform. The British London Metal Exchange was founded in 1877.
Energy futures trading, however, only began with the foundation of the International Petroleum Exchange (IPE) in London in 1980. Since 2005, the IPE operates under the name ICE Futures. Trading of WTI crude oil at the New York Mercantile Exchange (NYMEX) began in 1983; trading of Brent crude oil began in 1988. In terms of traded volume, the Chicago Mercantile Exchange (CME), founded in 1998, is the world's most important futures exchange. There are about 30 commodity exchanges worldwide; the most important are listed in Table 57.2. Based on traded volume, the majority of commodity futures trading takes place in the United States, the United Kingdom, Japan, and China.
Based on their historical return, risk, and correlation performance, commodity investments have an advantage over traditional assets, but exhibit some similarities to stocks. Kaplan and Lummer (1997), for example, conclude in their empirical investigation that commodities show an equity-like performance over the long run. This finding is also supported by many other studies such as Greer (2000), who concludes that the performance of unlever-aged commodity indices from 1970 to 1999 was on average positive, and comparable to equities with regard to return and volatility.
Bodie and Rosansky (1980) analyze an equally weighted commodity futures portfolio between 1949 and 1976, and Gorton and Rouwenhorst (2006) between 1959 and 2004. Both studies confirm equity-like returns for commodities. In addition, during the high inflation period of the 1970s, commodities had the highest real returns by far of all asset classes. Gorton and Rouwenhorst also found differences with traditional assets. They show that commodity returns exhibit positive skewness, in contrast to stocks, which have negative skewness and thus include higher downside risk.
Table 57.2. Major Commodity Exchanges
Exchange Name | Abbreviation | Country | Traded Futures | Web site |
|---|---|---|---|---|
Chicago Board of Trade | CBOT | U.S. | Agricultural products and oil |
|
Chicago Mercantile Exchange | CME | U.S. | Agricultural products and livestock |
|
New York Mercantile Exchange | NYMEX | U.S. | Energy and metals |
|
Intercontinental Exchange | ICE | GB | Energy |
|
London Metal Exchange | LME | GB | Metals | Ime.co.uk |
Winnipeg Commodity Exchange | WCE | Canada | Agricultural products | wce.ca |
Tokyo Commodity Exchange | TOCOM | Japan | Energy and metals | tocom.or.jp |
Shanghai Metal Exchange | SHME | China | Metals |
|
Dalian Commodity Exchange | DCE | China | Agricultural products and oil | dce.com.cn |
Brazilian Mercantile and Futures Exchange | BM&F | Brazil | Agricultural products | bmf.com.br |
Risk Management Exchange | RMX | Germany | Agricultural products and livestock | wtb-hannover.de |
National Commodity and Derivatives Exchange | CDEX | India | Agricultural products and metals |
|
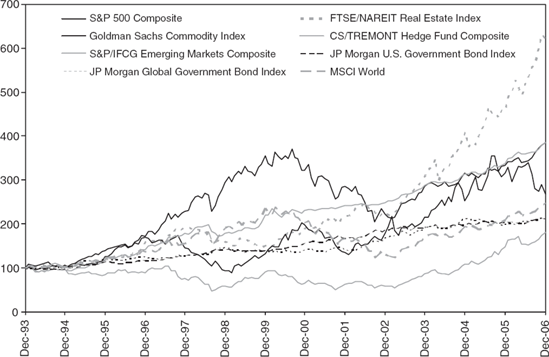
Figure 57.2 shows the performance of both traditional and alternative assets starting with a reference basis of 100 in December 1993. After consolidating in 2006, the GSCI, which is heavily invested in energy currently shows very strong performance, along with indirect real estate and hedge funds. In contrast, equity investments in emerging markets show the smallest price increases.
During the January 1994-December 2006 period, commodities had an annualized arithmetic return of 9.64% (and geometric annualized mean of 7.61%) with a volatility of 20.25% (see Table 57.3). The high variability can be explained by the GSCI's large share in energy. The energy sector currently represents over 70% of the total index (as at end of 2006), and is itself composed of 40% crude oil, which has experienced extreme volatility over the last few years. Thus, compared to other observed asset classes, commodities have a high average volatility. Note, however, that the downside risk of the S&P 500 Composite, the S&P/IFCG Emerging Markets, and the FTSE/NAREIT Real Estate Index are higher because of their negative skewness; commodities possess positive skewness.
The most beneficial investment in terms of the Sharpe ratio is the CS/Tremont Hedge Fund Index. However, hedge fund investors also face high excess kurtosis. When considering only return and volatility, an indirect investment in real estate also seems less favorable due to negative skewness and positive excess kurtosis. Furthermore, the poor performance of emerging market equities seen in Figure 57.2 is also confirmed by the descriptive statistics, especially considering the geometric mean as well as the exorbitant volatility.
As mentioned above, commodities serve an important diversification function in asset allocation due to their long-term low correlation with stocks, bonds, real estate, hedge funds, and, to a lesser extent, their absolute performance characteristics. According to Greer (2000), commodity indices have a negative correlation with stocks and bonds and a positive correlation with the inflation rate, especially unexpected changes in inflation. There are, however, significant differences among the individual commodity sectors: Energy, metals, livestock, and sugar show the best inflation hedging potential. Greer also finds very high correlation coefficients among different kinds of commodity sectors.
According to Kat and Oomen (2007), commodity futures and traditional assets like stocks and bonds are uncorrelated. In specific phases, the correlation admittedly increases—therefore not all commodities are useful for portfolio diversification in every market phase. However, even in down markets, commodities as a group do not lose their diversification potential. According to Anson (2006), there are three reasons for low or negative correlations between commodities and stocks/bonds. First, inflation has a positive effect on commodity prices, but a negative effect on equity and bond markets. Second, investor expectations in commodity markets are different from those in equity and bond markets. Finally, a trade-off between capital return and commodity return exists in industrial production.
Table 57.4 shows the return correlation structure between the total return indices of various asset classes. As can be seen, correlation is significant only at the 5% level between commodities and hedge funds, which turn out to be relatively low at 0.167. This can be traced back to the commodity trading advisers (CTAs) and managed futures funds included in the CS/Tremont Hedge Fund Composite Index.
Table 57.3. Annualized Average Monthly Return and Volatility (January 1994-December 2006)
Average annual | Minimum Annualized | Maximum Annualized | ||||||
|---|---|---|---|---|---|---|---|---|
Arithmetic Return | Geometric Return | Standard Deviation | Arithmetic Return | Arithmetic Return | Skewness | Excess Kurtosis | Sharpe Ratio | |
GSCI Composite | 9.64% | 7.61% | 20.25% | −14.41% | 16.88% | 0.063 | 0.024 | 0.281 |
S&P 500 Composite | 11.43% | 10.41% | 14.27% | −14.46% | 9.78% | −0.622 | 0.838 | 0.524 |
MSCI World | 7.91% | 7.00% | 13.43% | −13.45% | 8.91% | −0.658 | 0.890 | 0.294 |
Emerging Markets | 6.76% | 4.58% | 20.62% | −25.56% | 12.37% | −0.765 | 1.877 | 0.136 |
Hedge Funds Comp. | 10.71% | 10.42% | 7.66% | −7.55% | 8.53% | 0.099 | 2.465 | 0.882 |
Real Estate Index | 14.99% | 14.14% | 13.04% | −14.58% | 10.39% | −0.510 | 1.472 | 0.846 |
JPM U.S. Govt. Bonds | 5.91% | 5.80% | 4.65% | −4.68% | 3.71% | −0.509 | 1.084 | 0.421 |
JPM Global Bonds | 5.98% | 5.79% | 6.23% | −4.30% | 5.65% | 0.320 | 0.336 | 0.325 |
T-Bill Rate | 3.96% | 3.95% | 0.49% | 0.07% | 0.53% | −0.644 | −1.049 | – |
However, the return correlation between the money market and the commodity market is negative. Hence, the results of several academic studies are confirmed for our sample period: Commodities show a high diversification potential in traditional and alternative security portfolios. Chong and Miffre (2006) also find that conditional correlations between commodity futures and the S&P 500 decrease during times of down markets, that is, exactly when market risk increases and diversification is strongly needed. The conditional correlations between commodities and fixed income, on the other hand, increase during times of increased bond volatility.
In this section, we analyze whether an allocation in commodities yields any diversification benefits for a portfolio consisting of U.S. and global stocks, fixed income, and a riskless asset represented by the Treasury bill rate (that is, whether the efficient frontier shifts into the upper left corner in the expected return-standard deviation diagram). According to Markowitz (1952), these efficient portfolios (efficient in the sense that no others exhibit a superior risk/return combination) are located on the borderline formed by the set of all portfolios between the minimum variance (MVP) and the maximum return portfolio (MaxEP).
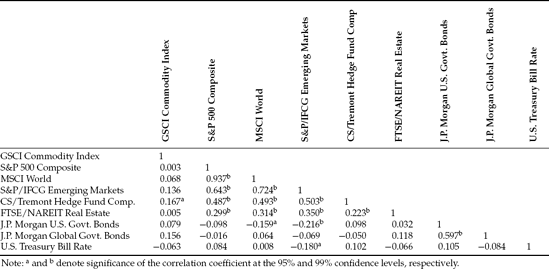
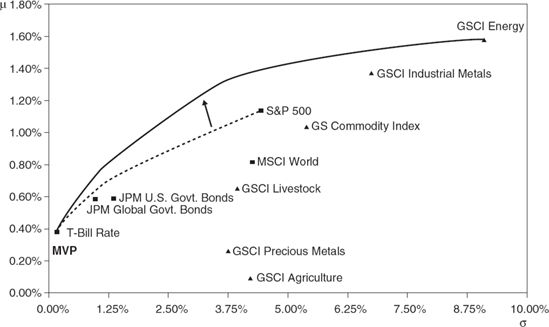
Figure 57.3 shows how portfolio efficiency can be improved by including commodities in a traditional portfolio, thus rotating the efficient frontier counterclockwise around the MVP (the Treasury bill rate). The upward shift of the efficient frontier also provides higher risk-adjusted returns. The efficient frontier of the traditional portfolio is limited by a 98% investment in Treasury bills for the MVP, and 100% in the S&P 500 for the MaxEP.
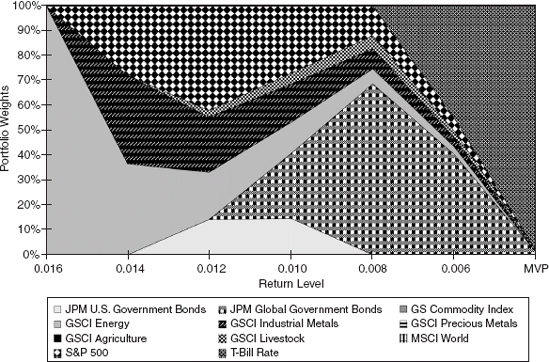
Starting from the MVP and incorporating individual commodity sectors, the share of global bonds initially increases to 69% (see Figure 57.4). Subsequently, the proportions of the energy and industrial metals sectors increase continuously, together with the share of U.S. stocks. At a monthly return level of about 1%, livestock is represented with a share of about 4% to 5%. However, agricultural and precious metals are excluded entirely from the allocation. At a monthly return level of about 1.4%, the portfolio only consists of an allocation in the S&P 500 (28%), the energy sector (37%), and the industrial metals sector (35%).
Thus, with an increasing return level, the proportion of commodities in the portfolio expands as the allocation in U.S. stocks increases. It is remarkable that the GSCI Composite is not included in any allocations. It seems advisable to invest directly in the respective individual subsectors.
An allocation to commodities offers not only a hedge against inflation, but also effective diversification because of their low correlation with traditional asset classes. Over the long run, commodity investments show equity-like returns, accompanied by lower volatility and lower shortfall risk. These advantages hold for passive investment in commodity futures indices, which are considered indicators of commodity market price movements. However, the futures indices of individual providers differ with regard to sector weights, index construction, and calculation method—hence there are tremendous variations in risk/return characteristics.
Adams, Z., Fuss, R., and Kaiser, D. G. (2008). Macroeconomic determinants of commodity futures returns. In F. J. Fabozzi, R. Fuss, and D. G. Kaiser (eds.), The Handbook of Commodity Investing (pp. 87-112). Hoboken, NJ: John Wiley & Sons.
Akey, R. P. (2005). Commodities: A case for active management. Journal of Alternative Investments 8, 2: 8-30.
Anson, M. J. P. (2006). The Handbook of Alternative Assets, 2nd edition. Hoboken, NJ: John Wiley & Sons.
Bodie, Z., and Rosansky, V. I. (1980). Risk and return in commodity futures. Financial Analysts Journal 35, 3: 27-39.
Chong, J., and Miffre, J. (2006). Conditional risk premia and correlations in commodity futures markets. Working paper.
Doyle, E., Hill, J., and Jack, I. (2007). Growth in commodity investment: Risks and challenges for commodity. Financial Services Authority, working paper.
Edwards, F. R., and Neftci, S. (1998). Extreme price movements and margin levels in futures markets. Journal of Futures Markets 8: 639-655.
Erb, C., and Harvey, C. R. (2006). The tactical and strategic value of commodity futures. Financial Analysts Journal 62, 2: 69-97.
Füss, R., Hoppe, C, and Kaiser, D. G. (2008). Review of commodity futures performance benchmarks. In F. J. Fabozzi, R. Füss, and D. G. Kaiser (eds.), The Handbook of Commodity Investing (pp. 169-202). Hoboken, NJ: John Wiley & Sons.
Geman, H. (2005). Commodities and Commodity Derivatives: Modeling and Pricing for Agriculturals, Metals and Energy. Chichester: John Wiley & Sons.
Georgiev, G. (2005). Benefits of commodity investment. Working paper.
Gorton, G., and Rouwenhorst, K. G. (2006). Facts and fantasies about commodity futures. Financial Analysts Journal 62, 2: 47-68.
Greer, R. J. (1997). What is an asset class, anyway? Journal of Portfolio Management 23, 2: 86-91.
Greer, R. J. (2000). The nature of commodity index returns. Journal of Alternative Investments, Summer: 45-52.
Kaplan, P. D., and Lummer, S. L. (1997). GSCI collateralized futures as a hedging and diversification tool for institutional portfolios: An update. Working paper.
Kat, H. M., and Oomen, R. C. (2007). What every investor should know about commodities, Part II: Multivariate return analysis. Journal of Investment Management, Third Quarter: 1-25.
Markowitz, H. M. (1952). Portfolio selection. Journal of Finance 7,1: 77-91.
Scott, J. H. (1994). Managing asset classes. Financial Analysts Journal, January/February: 62-69.
Scherer, B. (2005). Commodities as an asset class: Testing for mean variance spanning under arbitrary constraints. Deutsche Bank—An Investors' Guide to Commodities (pp. 35-42). New York.
Till, H. (2001). Taking full advantage of the statistical properties of commodity investments. Journal of Alternative Investments 4,1: 63-66.