FRANK J. FABOZZI, PhD, CFA, CPA
Professor in the Practice of Finance, Yale School of Management
Abstract: The investment management process involves five steps: setting investment objectives, establishing an investment policy, selecting a portfolio strategy, constructing a portfolio, and evaluating performance. The investment process involves the analysis of the investment objectives of the entity whose funds are being invested. Given the investment objectives, an investor must then establish policy guidelines to satisfy the investment objectives. This phase begins with the decision as to how to allocate funds across the major asset classes and requires a thorough understanding of the risks associated with investing in each asset class. After establishing the investment objectives and the investment policy, the investor must develop a portfolio strategy. Portfolio strategies can be classified as either active or passive. The next step is to construct the portfolio by selecting the specific financial instruments to be included in the portfolio. Periodically, the investor must evaluate the performance of the portfolio and therefore the portfolio strategy. This step begins with the calculation of the investment return and then evaluates that return relative to the portfolio risk.
Keywords: individual investors, institutional investors, asset classes, mutual fund, systematic risk, unsystematic risk, inflation risk, credit risk, interest rate risk, duration, liquidity risk, exchange rate risk, reinvestment risk, call risk, prepayment risk, active portfolio strategy, passive portfolio strategy, efficient portfolio, performance evaluation
In this chapter the fundamentals of investing will be reviewed. We will explain these fundamentals in terms of the steps that are involved in investing. These steps include setting investment objectives, establishing an investment policy, selecting a portfolio strategy, constructing a portfolio, and evaluating performance.
The investment process begins with a thorough analysis of the investment objectives of the entity whose funds are being invested. These entities can be classified as individual investors and institutional investors.
The objectives of an individual investor may be to accumulate funds to purchase a home or other major acquisition, to have sufficient funds to be able to retire at a specified age, or to accumulate funds to pay for college tuition for children.
Institutional investors include:
Pension funds.
Depository institutions (commercial banks, savings and loan associations, and credit unions).
Insurance companies (life insurance companies, property and casualty insurance companies, and health insurance companies).
Regulated investment companies (mutual funds).
Endowments and foundations.
Treasury departments of corporations, municipal governments, and government agencies.
In general we can classify institutional investors into two broad categories—those that must meet contractually specified liabilities and those that do not. We refer to those in the first category as institutions with "liability-driven objectives" and those in the second category as institutions with "non-liability-driven objectives." Some institutions have a wide range of investment products that they offer investors, some of which are liability-driven and others that are non-liability-driven.
Once the investment objectives are identified, an investor must then establish policy guidelines to satisfy the investment objectives. Setting policy begins with the asset allocation decision. That is, a decision must be made as to how the investor's funds should be distributed among asset classes. In making the asset allocation decision, investors will look at the risk and return characteristics of the asset classes in which they may invest and the correlation between the returns of each asset class. We define what is meant by an asset class and the notion of risk in the sections to follow.
The asset allocation will take into consideration any investment constraints or restrictions. Asset allocation models are commercially available for assisting those individuals responsible for making this decision.
In the development of investment policies, the following factors must be considered:
Client constraints
Regulatory constraints
Accounting and tax issues
From the perspective of a U.S. investor, the convention today is to refer to the following as traditional asset classes:
U.S. common stocks
Non-U.S. (or foreign) common stocks
U.S. bonds
Non-U.S. (or foreign) bonds
Cash equivalents
Real estate
Cash equivalents are defined as short-term debt obligations that have little price volatility.
Common stock and bonds are further divided into other asset classes. For U.S. common stocks, the following are classified as asset classes:
| Large-capitalization stocks |
| Mid-capitalization stocks |
| Small-capitalization stocks |
| Growth stocks |
| Value stocks |
"Capitalization" means the market capitalization of the company's common stock. It is equal to the total market value of all of the common stock outstanding for that company. For example, suppose that a company has 100 million shares of common stock outstanding and each share has a market value of $10. Then the market capitalization of this company is $1 billion (100 million shares times $10 per share). The market capitalization of a company is commonly referred to as its "market cap" or simply "cap."
While the market cap of a company is easy to determine given the market price per share and the number of shares outstanding, how does one define "value" and "growth" stocks? We'll see how that is done in Chapter 30 of Volume II.
For U.S. bonds, the following are classified as asset classes:
| U.S. government bonds |
| Investment-grade corporate bonds |
| High-yield corporate bonds |
| U.S. municipal bonds (that is, state and local bonds) |
| Mortgage-backed securities |
| Asset-backed securities |
All of these securities are described in later chapters, where what is meant by "investment grade" and "high yield" is also explained. Sometimes, the first three bond asset classes listed above are further divided into "long term" and "short term."
The following asset classes are classified for the non-U.S. common stock and bond asset classes:
| Developed market foreign stocks |
| Emerging market foreign stocks |
| Developed market foreign bonds |
| Emerging market foreign bonds |
In addition to the traditional asset classes listed above, there are asset classes commonly referred to as alternative asset classes. Some of the more popular ones include hedge funds, private equity, venture capital, and managed futures.
How does one define an asset class? One highly respected investment manager, Mark Kritzman (1959, p. 79), describes how this is done as follows:
... [S]ome investments take on the status of an asset class simply because the managers of these assets promote them as an asset class. They believe that investors will be more inclined to allocate funds to their products if they are viewed as an asset class rather than merely as an investment strategy.
He then goes on to propose criteria for determining asset class status, although we won't review the criteria he proposed here.
Along with the designation of an investment as an asset class comes a barometer to be able to quantify performance—the risk, return, and the correlation of the return of the asset class with that of other asset classes. The barometer is called a "benchmark index" or simply "index." Listed in Table 2.1 are benchmark indexes for the various asset classes that cover common stocks.
If an investor wants exposure to a particular asset class, he or she must be able to buy a sufficient number of the individual securities comprising the asset class. This means that if an investor wants exposure to the U.S. large-cap equity market and the S&P 500 is the index (consisting of 500 companies) representing that asset class, then the investor cannot simply buy the shares of a handful of companies and hope to acquire the expected exposure to that asset class. For institutional investors, acquiring a sufficient number of individual securities comprising an asset class is often not a problem. However, for individual investors, obtaining exposure to an asset class by buying a sufficient number of individual securities is not simple. How can individual investors accomplish this?
Table 2.1. Benchmark Indexes for Common Stock Asset Classes
Asset Class | Benchmark Index |
|---|---|
U.S. Large-Cap Equity | Standard & Poor's (S&P) 500 |
U.S. Large-Cap Value | Frank Russell 1000 Value, S&P/Barra 500 Value |
U.S. Large-Cap Growth | Frank Russell 1000 Growth, S&P/Barra 500 Growth |
U.S. Mid-Cap Equity | Frank Russell Mid Cap |
U.S. Small-Cap Equity | Frank Russell 2000 |
U.S. Small-Cap Value | Frank Russell 2000 Value |
U.S. Small-Cap Growth | Frank Russell 2000 Growth |
International Equity | Morgan Stanley Capital International (MSCI) EAFE, Salomon Smith Barney International, MSCI All Country World (ACW1) ex U.S. |
Emerging Markets | MSCI Emerging Markets |
Fortunately, there is an investment vehicle that can be used to obtain exposure to asset classes in a cost-effective manner. The vehicle is an investment company, more popularly referred to as a mutual fund. This investment vehicle is the subject of Chapter 60 in Volume I. For now, what is important to understand is that there are mutual funds that invest primarily in specific asset classes. Such mutual funds offer investors the opportunity to gain exposure to asset classes without having expertise in the management of the individual securities in that asset class and by investing a sum of money that, in the absence of a mutual fund, would not allow the investor to acquire a sufficient number of individual assets to obtain the desired exposure.
There are various measures of risk. We will describe each of them here.
Total Risk
The dictionary defines risk as "hazard, peril, exposure to loss or injury." With respect to investments, investors have used a variety of definitions to describe risk. Today, the most commonly accepted definition of risk is one that involves a well-known statistical measure known as the variance. Specifically, investors quantify risk in terms of the variance of an asset's expected return. The variance of a random variable is a measure of the dispersion of the possible outcomes around the expected value. In the case of an asset's return, the variance is a measure of the dispersion of the possible outcomes for the return around the expected return.
There are two criticisms of the use of the variance as a measure of risk. The first criticism is that since the variance measures the dispersion of an asset's return around its expected value, it considers the possibility of returns above the expected return and below the expected return. Investors, however, do not view possible returns above the expected return as an unfavorable outcome. In fact, such outcomes are favorable. Because of this, some researchers have argued that measures of risk should not consider the possible returns above the expected return. Various measures of downside risk, such as risk of loss and value at risk, are currently being used by practitioners. The second criticism is that the variance is only one measure of how the returns vary around the expected return. When a probability distribution is not symmetrical around its expected return, then a statistical measure of the skewness of a distribution should be used in addition to the variance.
One way of reducing the risk associated with holding an individual security is by diversifying. Often, one hears investors talking about diversifying their portfolio. By this an investor means constructing a portfolio in such a way as to reduce portfolio risk without sacrificing return. This is certainly a goal that investors should seek. However, the question is, how does one do this in practice?
Some investors would say that a portfolio can be diversified by including assets across all asset classes. For example, one investor might argue that a portfolio should be diversified by investing in stocks, bonds, and real estate. While that might be reasonable, two questions must be addressed in order to construct a diversified portfolio. First, how much should be invested in each asset class? Should 40% of the portfolio be in stocks, 50% in bonds, and 10% in real estate, or is some other allocation more appropriate? Second, given the allocation, which specific stocks, bonds, and real estate should the investor select?
Some investors who focus only on one asset class such as common stock argue that such portfolios should also be diversified. By this they mean that an investor should not place all funds in the stock of one company, but rather should include stocks of many companies. Here, too, several questions must be answered in order to construct a diversified portfolio. First, which companies should be represented in the portfolio? Second, how much of the portfolio should be allocated to the stocks of each company?
Prior to the development of portfolio theory by Harry Markowitz (1952), while investors often talked about diversification in these general terms, they never provided the analytical tools by which to answer the questions posed here. Markowitz demonstrated that a diversification strategy should take into account the degree of covari-ance or correlation between asset returns in a portfolio. (The covariance or correlation of asset returns is a measure of the degree to which the returns on two assets vary or change together.) Indeed, a key contribution of what is now popularly referred to as "Markowitz diversification" or "mean-variance diversification" is the formulation of a security's risk in terms of a portfolio of securities, rather than the risk of an individual security. Markowitz diversification seeks to combine securities in a portfolio with returns that are less than perfectly positively correlated in an effort to lower portfolio risk (variance) without sacrificing return. It is the concern for maintaining return, while lowering risk through an analysis of the covariance between security returns, that separates Markowitz diversification from other approaches suggested for diversification and makes it more effective.
The principle of Markowitz diversification states that as the correlation (covariance) between the returns for assets that are combined in a portfolio decreases, so does the variance of the return for that portfolio. The good news is that investors can maintain expected portfolio return and lower portfolio risk by combining assets with lower (and preferably negative) correlations. However, the bad news is that very few assets have small to negative correlations with other assets. The problem, then, becomes one of searching among a large number of assets in an effort to discover the portfolio with the minimum risk at a given level of expected return or, equivalently, the highest expected return at a given level of risk.
Systematic versus Unsystematic Risk
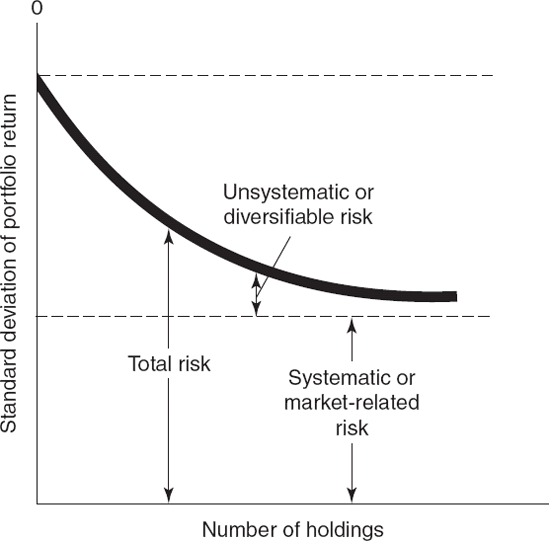
The total risk of an asset or a portfolio can be divided into two types of risk: systematic risk and unsystematic risk. William Sharpe (1963) defined systematic risk as the portion of an asset's variability that can be attributed to a common factor. It is also called undiversifiable risk or market risk. Systematic risk is the minimum level of risk that can be attained for a portfolio by means of diversification across a large number of randomly chosen assets. As such, systematic risk is that which results from general market and economic conditions that cannot be diversified away.
Sharpe defined the portion of an asset's variability that can be diversified away as unsystematic risk. It is also called diversifiable risk, unique risk, residual risk, idiosyncratic risk, or company-specific risk. This is the risk that is unique to a company, such as a strike, the outcome of unfavorable litigation, or a natural catastrophe.
How diversification reduces unsystematic risk for portfolios is illustrated in Figure 2.1. The vertical axis shows the variance of a portfolio's return. This variance represents the total risk for the portfolio (systematic plus unsystematic). The horizontal axis shows the number of holdings of different assets (e.g., the number of common stock held of different issuers). As can be seen, as the number of asset holdings increases, the level of unsystematic risk is almost completely eliminated (that is, diversified away). Studies of different asset classes support this. For example, for common stock, several studies suggest that a portfolio size of about 20 randomly selected companies will completely eliminate unsystematic risk leaving only systematic risk. (The first study of this type was by Wagner and Lau 1971.) In the case of corporate bonds, generally less than 40 corporate issues are needed to eliminate unsystematic risk.
The relationship between the movement in the price of an asset and the market can be estimated statistically. There are two products of the estimated relationship that investors use. The first is the beta of an asset. Beta measures the sensitivity of an asset's return to changes in the market's return. Hence, beta is referred to as an index of systematic risk due to general market conditions that cannot be diversified away. For example, if an asset has a beta of 1.5, it means that, on average, if the market changes by 1%, the asset's return changes by about 1.5%. The beta for the market is 1. A beta greater than 1 means that the systematic risk is greater than that of the market; a beta less than 1 means that the systematic risk is less than that of the market. Brokerage firms, vendors such as Bloomberg, and online Internet services provide information on beta for common stock.
The second product is the ratio of the amount of systematic risk relative to the total risk. This ratio is called the coefficient of determination or R-squared. This ratio varies from 0 to 1. A value of 0.8 for a portfolio means that 80% of the variation in the return of the portfolio is explained by movements in the market. For individual assets, this ratio is typically low because there is a good deal of unsystematic risk. However, through diversification the ratio increases as unsystematic risk is reduced (see Figure 2.1).
Inflation or Purchasing Power Risk
Inflation risk, or purchasing power risk, arises because of the variation in the value of an asset's cash flows due to inflation, as measured in terms of purchasing power. For example, if an investor purchases an asset that produces an annual return of 5% and the rate of inflation is 3%, the purchasing power of the investor has not increased by 5%. Instead, the investor's purchasing power has increased by 2%. Inflation risk is the risk that the investor's return from the investment in an asset will be less than the rate of inflation.
Common stock is viewed by some as having little inflation risk. For all but inflation protection bonds, an investor is exposed to inflation risk by investing in fixed-rate bonds because the interest rate the issuer promises to make is fixed for the life of the issue.
Credit Risk
An investor who purchases a security not guaranteed by the U.S. government is viewed as being exposed to credit risk. There are several forms of credit risk: default risk, downgrade risk, and spread risk.
Default risk is defined as the risk that the issuer will fail to satisfy the terms of the obligation with respect to the timely payment of interest and repayment of the amount borrowed thereby forcing the issuer into bankruptcy. All investors in a bankrupt entity (common stockholders and bondholders) will realize a decline in the value of their security as a result of bankruptcy.
In the case of bonds, investors gauge the credit risk of an entity by looking at the credit ratings assigned to issues by rating companies, popularly referred to as rating agencies. There are three rating agencies in the United States: Moody's Investors Service, Inc., Standard & Poor's Corporation, and Fitch. These ratings are discussed in Chapter 24 of Volume III. When the credit rating of a bond is lowered by a rating agency, this action by a rating agency is referred to as the downgrading of a bond. The risk that a bond will be downgraded is called downgrade risk.
Credit spread risk is the risk that credit spreads in the market will increase resulting in poor performance of the bonds owned.
Liquidity Risk
When an investor wants to sell an asset, he or she is concerned whether the price that can be obtained from dealers is close to the true value of the asset. For example, if recent trades in the market for a particular asset have been between $40 and $40.50 and market conditions have not changed, an investor would expect to sell the asset in that range.
Liquidity risk is the risk that the investor will have to sell an asset below its true value where the true value is indicated by a recent transaction. The primary measure of liquidity is the size of the spread between the bid price (the price at which a dealer is willing to buy an asset) and the ask price (the price at which a dealer is willing to sell an asset). The wider the bid-ask spread, the greater the liquidity risk.
Liquidity risk is also important for portfolio managers that must mark to market positions periodically. For example, the manager of a mutual fund is required to report the market value of each holding at the end of each business day. This means accurate price information must be available. Some assets do not trade frequently and are therefore difficult to price.
Exchange Rate or Currency Risk
An asset whose payments are not in the domestic currency of the investor has unknown cash flows in the domestic currency. The cash flows in the investor's domestic currency are dependent on the exchange rate at the time the payments are received from the asset. For example, suppose an investor's domestic currency is the U.S. dollar and that the investor purchases an asset whose payments are in euros. If the euro depreciates relative to the U.S. dollar at the time a euro payment is received, then fewer U.S. dollars will be received.
The risk of receiving less of the domestic currency than is expected at the time of purchase when an asset makes payments in a currency other than the investor's domestic currency is called exchange rate risk or currency risk.
Risks for Bonds
There are systematic risks that affect bond returns in addition to those described above. They include interest rate risk, call/prepayment risk, and reinvestment risk.
Interest Rate Risk
The price of a bond changes as interest rates change. Specifically, price moves in the opposite direction to the change in interest rates. That is, if interest rates increase, the price of a bond will decline; if interest rates decrease, the price of a bond will increase. This is the reason a bond will sell above its par value (that is, sell at a premium) or below its par value (that is, sell at a discount). The risk that the price of a bond or bond portfolio will decline when interest rates increase is called interest rate risk.
The sensitivity of the price of a bond to changes in interest rates depends on the following factors:
The bond's coupon rate
The bond's maturity
The level of interest rates
Specifically, the following relationships hold:
All other factors being constant, the lower the coupon rate, the greater the price sensitivity of a bond for a given change in interest rates.
All other factors being constant, the longer the maturity, the greater the price sensitivity of a bond for a given change in interest rates.
All other factors being constant, the lower the level of interest rates, the greater the price volatility of a bond for a given change in interest rates.
Consequently, the price of a zero-coupon bond with a long maturity is highly sensitive to changes in interest rates. The price sensitivity is even greater in a low interest rate environment than in a high interest rate environment. For money market instruments, since their maturity is less than one year, the price is not very sensitive to changes in interest rates.
The price sensitivity of a bond to changes in interest rates can be estimated. This measure is called the duration of a bond. Duration is the approximate percentage change in the price of a bond for a 100-basis-point change in interest rates. For example, if a bond has a duration of 8, this means that for a 100-basis-point change in interest rates, the price will change by approximately 8%. For a 50-basis-point change in interest rates, the price of this bond would change by approximately 4%.
Given the price of a bond and its duration, the dollar price change can be estimated. For example if our bond with a duration of 8 has a price of $90,000, the price will change by about 8% for a 100-basis-point change in interest rates and therefore the dollar price change will be about $7,200 (8% times $90,000). For a 50-basis-point change, the price would change by about $3,600.
The concept of duration applies to a bond portfolio also. For example, if an investor has a bond portfolio with a duration of 6 and the market value of the portfolio is $1 million, this means that a change in interest rates of 100 basis points will change the value of the portfolio by approximately 6% and therefore the value of the portfolio will change by approximately $60,000. For a 25-basis-point change in interest rates, the portfolio's value will change by approximately 1.5% and the portfolio's value will change by approximately $15,000.
How is duration computed? First, two prices are computed. One is based on an increase in interest rates and the second is based on a decrease in interest rates. Duration is then computed as follows:
Typically, interest rates fluctuate up and down by an amount less than 50 basis points. But regardless of the rate change used, the interpretation is still that it is the approximate percentage price change for a 100-basis-point change in rates.
There are limitations of duration that the investor should recognize. First, in calculating duration or using the duration provided by financial consultants or fund managers, it is assumed that the prices calculated in the numerator are done properly. This is not a problem for simple bonds. However, there are bonds where if interest rates are changed the estimated price must be estimated by complex pricing models. In turn, those models are based on several assumptions. So, for example, it is not surprising that two brokers providing information on duration for a complex bond could have materially different estimates. One broker could report a duration of four while another a duration of six! Moreover, mutual fund managers who manage a portfolio containing a large allocation to complex bonds could report a duration that is significantly different than the true price sensitivity of the fund to changes in interest rates due to improperly calculating the duration of the complex bonds.
The second limitation of duration is that it is a good approximation for small changes in interest rates (e.g., 50-basis-point change in rates) but the approximation is poorer for a larger change in interest rates. This does not mean that it is not useful for giving the investor a feel for the price sensitivity of a bond or a portfolio.
The third limitation has to do with the duration of a portfolio. In computing the duration of the portfolio, first the duration of each bond in the portfolio is computed. Then a weighted average of the duration of the bonds in the portfolio is computed to get the portfolio duration. The limitation comes about because it is assumed that the interest rate for all maturities change by the same number of basis points. So, if a portfolio has a 2-year, a 10-year, and a 20-year bond, when using a portfolio's duration it is assumed that the 2-year, 10-year, and 20-year bonds change by the same number of basis points. This assumption is commonly referred to as the "parallel yield curve assumption."
Call/Prepayment Risk
A bond may include a provision that allows the issuer to retire or call all or part of the issue before the maturity date. From the investor's perspective, there are three disadvantages to call provisions. First, the cash flow pattern of a callable bond is not known with certainty because it is not known when the bond will be called. Second, because the issuer is likely to call the bonds when interest rates have dropped below the bond's coupon rate, the investor is exposed to reinvestment risk; this is risk that the investor will have to reinvest the proceeds when the bond is called at interest rates lower than the bond's coupon rate. Finally, the price appreciation potential of a bond will be reduced relative to an otherwise comparable bond without a call provision. Because of these three disadvantages faced by the investor, a callable bond is said to expose the investor to call risk. The same disadvantages apply to mortgage-backed and asset-backed securities where the borrower can prepay. In this case the risk is referred to as prepayment risk.
Reinvestment Risk
Reinvestment risk is the risk that proceeds available for reinvestment must be reinvested at a lower interest rate than the instrument that generated the proceeds. In addition to reinvestment risk when investing in a callable or prepayable bond, reinvestment risk occurs when an investor purchases a bond and relies on the yield of that bond as a measure of return potential. This point we be discussed later.
Given the investment objectives and the investment policy, the investor must then develop a portfolio strategy. Portfolio strategies can be classified as either active or passive.
An active portfolio strategy uses available information and forecasting techniques to seek a better performance than a portfolio that is simply diversified broadly. Essential to all active strategies are expectations about the factors that influence the performance of an asset class. For example, with active common stock strategies this may include forecasts of future earnings, dividends, or price-to-earnings ratios. With bond portfolios that are actively managed, expectations may involve forecasts of future interest rates and sector spreads. Active portfolio strategies involving foreign securities may require forecasts of local interest rates and exchange rates.
A passive portfolio strategy involves minimal expecta-tional input, and instead relies on diversification to match the performance of some index. In effect, a passive strategy assumes that the marketplace will reflect all available information in the price paid for securities. Between these extremes of active and passive strategies, new strategies have sprung up that have elements of both. For example, the core of a portfolio may be passively managed with the balance actively managed.
Given the choice among active or passive management, which should be selected? The answer depends on the investor's view of how "price-efficient" the market is and the investor's risk tolerance. By marketplace price efficiency we mean how difficult it would be to earn a greater return than passive management after adjusting for the risk associated with a strategy and the transaction costs associated with implementing that strategy. If an asset class is highly price efficient, the investor would want to pursue a passive strategy.
The most common passive strategy is indexing. In indexing, the investor designs a portfolio so that it will replicate the performance of the index.
Once a portfolio strategy is selected, the next step is to select the specific financial instruments to be included in the portfolio. (In the discussion to follow, we will refer to financial instruments as "securities.") This requires an evaluation of each security and the creation of an efficient portfolio. An efficient portfolio is one that provides the greatest expected return for a given level of risk, or equivalently, the lowest risk for a given expected return.
As just mentioned, an investor who pursues the most popular form of a passive strategy, indexing, will assemble a portfolio that attempts to match the performance of the index. In theory, it is quite simple to do. An investor can purchase every security in the index. The amount purchased of a particular security should be equal to the percentage of that security in the index.
From a practical perspective, it may be difficult to buy all the securities comprising an index for several reasons. First, transaction costs from buying and rebalancing the indexed portfolio may be too expensive, resulting in the underperformance of the indexed portfolio relative to the index. Second, the amount to be invested may be such that all of the securities comprising the index cannot be acquired. For example, if an investor has $10,000 to invest in the stock market, the stock of only a few companies could be acquired. Finally, in some indexes not all of the securities can be acquired without great difficulty. For example, in the case of indexing to match the performance of a bond index, some of the bond issues included in the index may not trade frequently and are difficult to acquire.
For individuals, index replication is typically not accomplished by buying individual securities. Rather, if available, a mutual fund that has as its objective the creation of a portfolio to replicate an index can be purchased. This overcomes the problems of the individual investor creating the indexed portfolio. Managers of mutual funds have a larger amount to invest and therefore can acquire a large number of securities in the index and can do so minimizing transaction costs. A good example is the common stock indexed mutual funds.
For institutional investors, even with a large amount of funds to invest, the portfolio manager still faces the problem of transaction costs and unavailability of certain securities. There are trading arrangements that have been developed in some markets that allow for more efficient execution of trades so as to minimize transaction costs and therefore the likelihood that the indexed portfolio will un-derperform the index. For common stock, these trading arrangements are described in Chapter 11 of Volume I and Chapter 28 of Volume II. In the case of unavailable securities or a universe of securities so large that it is impractical to acquire all the securities in the index, there are methodologies that can be used to minimize the risk of not matching the index. We'll discuss this further below.
In an active strategy, an investor is seeking to outperform the index or, in the case of liability-driven institutional investors, earn a higher return than a liability that it must pay. The construction of an active portfolio begins with an analysis of the factors that have historically determined the return on the index. Once these factors are identified, then the index can be decomposed into these factors or, more specifically, a risk profile of the index can be identified based on these factors.
Active management involves a deliberate decision by the portfolio manager to create a portfolio that departs from the risk profile of the index by accepting a larger or smaller exposure to one or more factors. Departures from the risk profile of the index represents bets on these factors. For example, consider common stock. One of the important factors that determines the risk profile of a common stock index such as the S&P 500 is the composition of the index in terms of industry sectors. Suppose that a portfolio manager believes that he or she can select industry sectors that can outperform and underperform. Then the portfolio manager will deliberately overweight the industry sectors that are expected to outperform and underweight those that are expected to underperform.
For an indexing strategy, in contrast, this approach involves creating a portfolio with a profile that matches the risk profile (that is, matching the factors) of the index. This mitigates the problem mentioned earlier of having to buy all the securities in the index.
Periodically the investor must assess the performance of the portfolio and therefore the portfolio manager. This process begins with calculating the return realized over the investment period. The realized return is then compared to the return on the benchmark. The benchmark can be a market index or a minimum return established by a liability. The comparison will allow the investor to determine whether the portfolio outperformed, matched, or underperformed the benchmark.
However, the process does not stop there. It is common to compare the performance relative to the risk accepted—a reward-to-risk ratio. The most common measure used is the Sharpe ratio. The numerator of the Sharpe ratio is the return over the risk-free rate. The risk of the portfolio is measured by the standard deviation of the portfolio. The Sharpe ratio is thus:
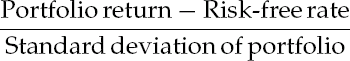
The Sharpe ratio is therefore is a measure of the excess return relative to the total variability of the portfolio.
For institutional investors, more elaborate techniques to assess performance are employed. The most common is the use of multifactor asset pricing models. While these models can be used to construct a portfolio, they can also be used to identify the reasons for underperformance or outperformance. These models do so by allowing the investor to determine the factor exposures that resulted in better or worse performance than the benchmark index.
The investment management process involves five steps: setting investment objectives, establishing the investment policy, selecting the portfolio strategy, constructing the portfolio, and evaluating performance. Policy guidelines are established in order to satisfy the investment objectives and begin with the asset allocation decision. The policy guidelines must take into consideration client-imposed constraints, regulatory constraints (if applicable), and accounting and tax factors. After establishing the investment objectives and guidelines, the next step is to formulate a portfolio strategy. In doing so, a decision must be made as to whether an active or passive portfolio strategy is to be pursued. The choice depends on the investor's view of the efficiency of the market for the asset classes in which funds are to be allocated. Given the portfolio strategy, the specific securities to be held in the portfolio must then be selected. After the portfolio has been assembled, performance must be periodically evaluated. This involves comparing the performance of the portfolio to the established benchmark.
Ammann, M., Kessler, S., and Tobler, J. (2006). Analyzing active investment strategies. Journal of Portfolio Management 32, 1: 56–67.
Anson, M. (2004). Strategic versus tactical asset allocation. Journal of Portfolio Management 29, 1: 8–22.
Ellis, C. D. (2003). The winner's game. Journal of Portfolio Management 28, 3: 27–34.
Fabozzi, F. J. (1999). Investment Management, 2nd edition, New Jersey, Prentice Hall.
Farr, D. D. (2006). Exploring the dimensions of active management 32, 1: 31–36.
Jacobs, B. I., and Levy, K. N. (2006). Enhanced active equity strategies. Journal of Portfolio Management 32, 3: 45–55.
Kritzman, M. (1999). Toward defining an asset class. Journal of Alternative Investments 2, 1: 79–82.
Markowitz, H. M. (1952). Portfolio selection. Journal of Finance 7, 1: 77–91.
Markowitz, H. M. (1959). Portfolio Selection. Cowles Foundation Monograph 16. New York: John Wiley & Sons.
Nanda, S., and Peters, D. (2006). A very long-term buy-and-hold portfolio. Journal of Portfolio Management 31, 2: 65–73.
Sharpe, W. F. (1964). Capital asset prices. Journal of Finance 19, 3: 425–442.
Wagner, W. H., and Lau, S. (1971). The effect of diversification on risks. Financial Analysts Journal 27, 6: 48–52.