When using Application Insights for logging and metrics, there are many more built-in capabilities of Application Insights that you can use. One of these capabilities is the possibility to execute search queries against all types of data collected by Application Insights from one view, called Search.
Here, it is possible to search all the information collected by Application Insights, including the following:
- Logs emitted by the application code, which includes NuGet packages and the .NET framework.
- All dependency calls: These are calls to databases and other systems that are automatically detected by Application Insights. Application Insights records the target system and duration.
- All exceptions: All exceptions that occur in an application are recorded by Application Insights, even if properly handled by the application code.
- Requests: Every user request that comes in over HTTP is logged. Important properties, such as the URL, duration, and HTTP verb, are also included.
To open the search view, navigate to the correct Application Insights instance and navigate to the Search tab (1) to get the view shown in the following screenshot:

In the Search view, several search parameters can be configured (2):
- An interval to search within: This defaults to the last 24 hours.
- The types of events to search in: This can be requests, log entries, page views, exceptions, dependency calls, and more.
- Any text to search for.
Within seconds, all matching results are shown in a bar chart. Each bar stands for a time period and shows how many matches there are within that time frame. Below this chart, all the individual matches are shown. These are a mix of all of the types of events available.
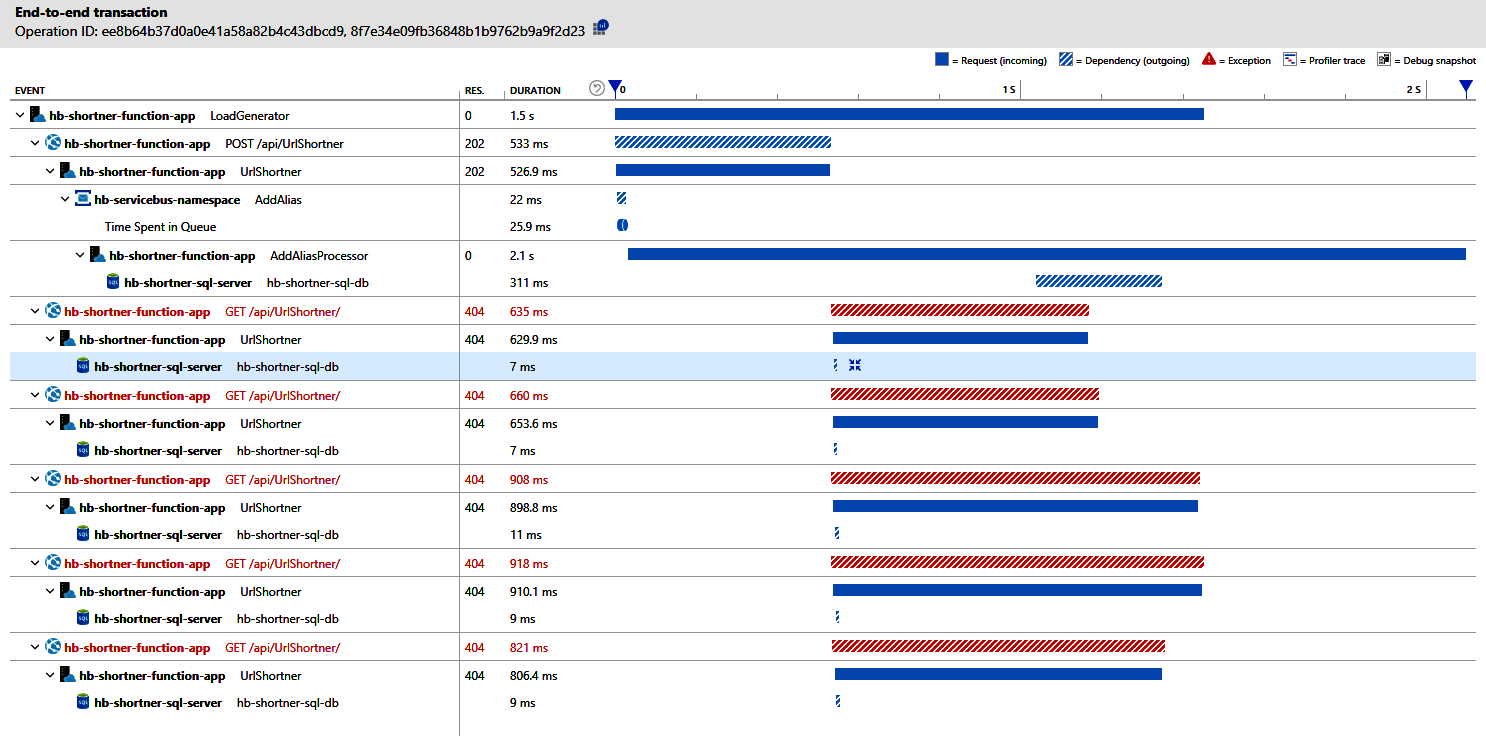
Clicking on any of the results opens a new view that shows the selected record in relation to all the other types, grouped per request. This allows you to quickly navigate to all the logs, dependency calls, and exceptions that are gathered by Application Insights during the execution of a single user request. The results can be displayed as a list and as a timeline. This allows you to very quickly see what the server was doing when performing the user request:
With all of these means to investigate applications and be notified regarding events, it is important to decide which alerts to create and which not to, not only in order to create a healthy working environment, but also to balance monitoring with new work. This is the topic of the next section.