
Absorbed log events can be shown within Interactive Analytics. All log events are presented by default even when no filters are added and provide event-based information as per the following conditions:
- As soon as a log message reaches the Log Insight server, it is timestamped.
- Log messages have relevant fields to create rapid and efficient queries, for example, hostname and appname are in syslog RFC-compliant fields.
- Fields can be also included by content packs and third-party tool integrations, such as the vmw_datacenter, vmw_object_id, and vmw_vcenter fields added by VMware integrations. We can make queries related to these fields to get specific log messages.
Query created by Log in to Log Insight Interactive Analysis:
- Create a query: Log Insight assists to use plain English words while searching for log messages. We can also create queries by leveraging regular expressions:

- Select the time range:
- Explore the time range drop-down menu by listing all options
- Check the Latest 24 hours of data:
We can get a display of only those log events with timestamps that are within the selected time range. The time zone set in the client web browser discovers the visible log messages. The event list will get amended with the last 24 hours of log messages.
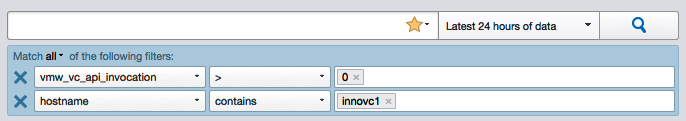
Log message output is related to matched values and operators in the filter.
The following are a few of the filter options to get the desired output:
- Operators manage filtering functions as we used to do with dashboards. Fields that have numeric values, such as latency numbers, have additional operators, such as <, >, or =.
- We have the option to match all or match any values in the filters while two or more filters are created.
- We can select a new field by clicking the down arrow and scrolling to the required field. We can also type the filter into the search box and Log Insight will match results as per the typed word. By default, new filters have a text field.
Log Insight leverages using globs in queries. * helps to match various characters. ? only supports one character while using fail* could give back (failed, failure, or failing) as outputs but erro? will mostly come back with the word error as output. Log Insight will verify a match corresponding to what we typed while inputting a value. The OR constraint can be used for multiple values for a single filter line, such as text containing esx-03a OR esx-01a.
Cumulative functions: We can also manage the data that operates the Overview chart in Log Insight with cumulative functions. The default cumulative function count of events over time is presented above the search box, and clicking the drop-down menu will give us additional functions. Multiple functions can be included in a chart. This assists in displaying a single event in two different ways. The overview chart will amend and add the unique count of hostnames in the console as a line. Each column and line will present information. The column will display the count of events for a specific time frame. The line can give a view of the number of hostnames which have matching error logs during the mentioned time frame. We will group the results/events by hostname and information will come by that displays the time range and count events for a specific hostname. Different charts are also accessible and Log Insight will by default automatically choose the best chart for the dataset. We can manually select charts to display the data in various ways.
Now, we will explore the vRealize Network Insight tool, which provides end-to-end visibility about all network packets and how they are travelling from one object to another, along with predictive analysis for better planning and design.