In this activity, we work with the following website: http://www.eddataexpress.ed.gov/index.cfm. We work with statistics about the U.S. government. We will change the format of the chart. We are only going to use the data in order to stick to the figures. We choose a state to work with—New York. We look for the statistics about the population. After reading the content information, we confirm the usage of the data.
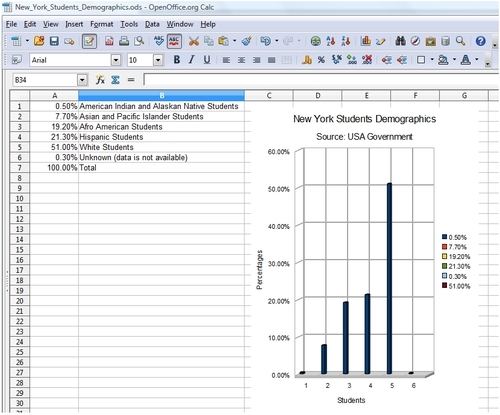
Now, we can work with the statistics about New York Students Demographics. There are five percentages in the chart and we take into account those figures in order to design a column chart:
- 0.5 percent of American Indian and Alaskan Native Students: 2008-2009
- 7.7 percent of Asian and Pacific Islander Students: 2008-2009
- 19.2 percent of Afro-American Students: 2008-2009
- 21.3 percent of Hispanic Students: 2008-2009
- 51.0 percent of Anglo-Saxon Students: 2008-2009
- 0.3 percent Unknown (the data is not available)
We have already found the statistics that we are going to work with. Then, we have to add those figures in a chart. We are going to use OpenOffice.org. We can download it from the following website: http://download.openoffice.org/index.html.
After installing OpenOffice, we work with Spreadsheet. Thus, we click on the said icon. Follow these steps in order to draw the chart:
- Click on the icon of Number Format: Percent, with the % symbol. Then, type the first percentage in A1.
- Enter the demographic information in B1.
- Repeat steps 1 and 2, and then enter the data in A2, B2, and so on.
- In A7, click on the Sum icon. Highlight A1 up to A6; the total percentage will appear there.
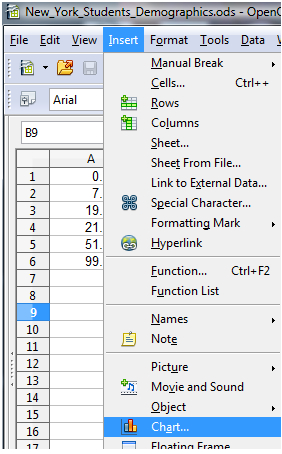
- Highlight A1 up to A6 again. Click on Insert | Chart, as shown in the following screenshot:
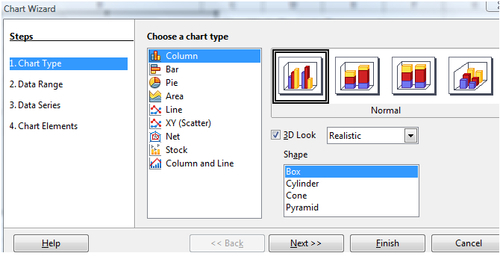
- Choose Column. You can add 3D effects if you click on the 3D Look block. There are also different types of columns within the Shape block, as shown in the following screenshot:
- Click on Next or Data Range.
- The range is the information that you use to display in the chart. You have already highlighted the range; as a result, you have verified that it is correct.
- Choose whether to show the data in rows or in columns. Click on the radio button Data series in columns.
- Click on Next or Data Series.
- Add the information of the percentages. Complete the Range for Name block with the absolute directions of the blocks in the spreadsheet. Click on Add to add the necessary ones. In this case, we do need six.
- Click on Next or Chart elements.
- Complete the Title, Subtitle, X axis, and Y axis blocks with the information about the statistics that you are working with.
- Click on Finish.
- The chart will appear, as shown in the following screenshot:
- You can right-click on the image. Copy it and paste it in software such as Paint or Inkscape and save it as
.png. Therefore, you can upload it to the Moodle course as an image. - Another possibility is to save the file. Thus, whenever you open it, the chart appears, as shown in the previous screenshot.
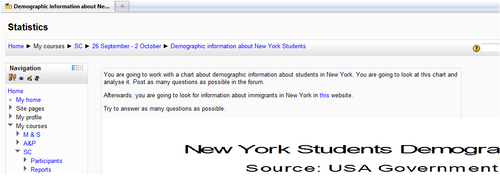
We have already designed the chart that we are going to work with. It's time to think of an activity. Therefore, an important link to this information is Ellis Island, where many immigrants from different parts of the world arrived. There were many reasons for them to do so, explained in the following website in a timeline: http://www.ellisisland.org/immexp/wseix_4_3.asp?. We have found a historic connecting element to our chart. We could design the activity in a Forum.
We can also upload either the image of the chart or the file that we have created to our activity within the Moodle course. Choose the weekly outline section where you want to insert this activity and follow these steps:
- Click on Add an activity | Forum.
- Complete the Forum name block.
- Click on the downwards arrow in Forum type and choose Q and A forum.
- For uploading the image of the chart, click on the Insert/edit image icon | Find or upload an image | Browse, and look for the image that you have just saved.
- Click on Upload this file.
- Complete the Image description block and click on Insert.
- Make a link to the aforementioned website.
- Click on Save and return to course. The activity looks as shown in the following screenshot: