
In this recipe, we work with an interactive chart, which is to be created after conducting a survey on our students. Therefore, our first step is to design a survey in our Moodle course.
We design an activity to ask our students to vote in order to create the interactive pie chart. We create the activity in a choice so that students can choose their favorite type of computer games. Afterwards, we draw the interactive chart with the results.
Choose the weekly outline section where you want to add the activity. These are the steps that you are going to follow:
- Click on Add an activity | Choice.
- Complete the Choice name and Introduction text blocks.
- Complete the Options blocks.
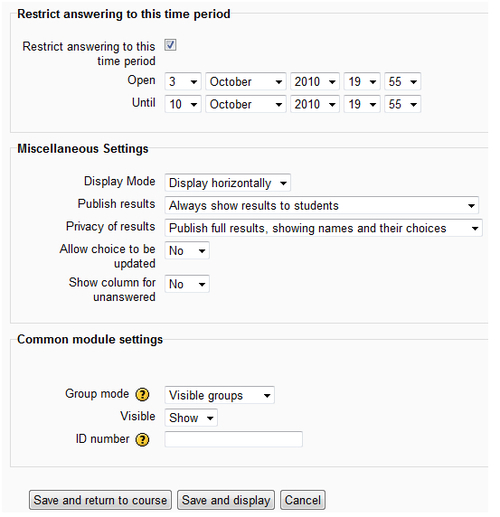
- Complete the Restrict answering to this time period, Miscellaneous Settings, and Common module settings blocks, as shown in the following screenshot:
- Click on Save and return to course.
Students click on the activity and vote. The way that this activity was designed, it won't allow students to vote more than once. This activity works as shown in the following screenshot:
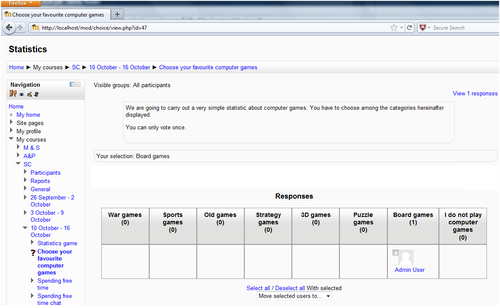
By the way, I have voted for board games; as you can see, I have no choice to vote again, and also we can see how many people voted.
After gathering the votes of our students, we can design the pie chart showing the results. Therefore, we can use Google Docs to create the interactive chart, write the data, and insert the chart, as shown in the following screenshot:
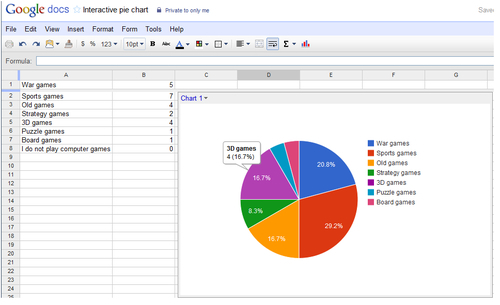
We have just used Google Docs like in the previous recipe, so we follow the same steps in order to create the chart, but in this case we choose pie chart.
We have already designed the chart in Google Docs and it is time to upload it in our Moodle course. We can create several types of activities where we can use the pie chart as a resource to enhance our Moodle course. The only step that we have to bear in mind is to copy the HTML code as we did in the previous recipe in order to paste it and embed the chart in our Moodle course.
In order to get the HTML code from Google Docs, follow these steps:
- Click on the downwards arrow in Share | Publish as a web page.
- Another pop-up window appears. Click on the downwards arrow below Get a link to the published data.
- Click on HTML to embed in a page.
- Copy the HTML code that appears in the block that reads Copy and paste the link above.
- Click on Close.
- Now that we have the HTML code, we can paste it in any activity that we want to design in our Moodle course.