
This is a very simple recipe. We design and insert an X Y (Scatter) chart in our Moodle course using http://www.editgrid.com/.
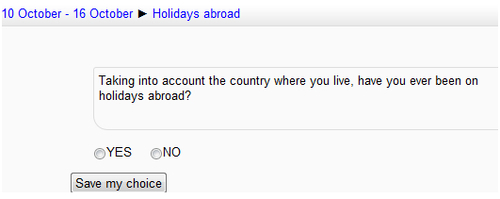
We ask our students through a Choice, as we have done in a previous recipe, if they have traveled abroad on holidays. This is a suggestion; you may change the subject of the poll. As it is a yes/no poll, it is very easy to design a chart. Let's see how to do it!
We enter our Moodle course and select the weekly outline section. We just design a poll in order to gather data to insert the chart afterwards. Therefore, we limit the choice to one week. These are the steps that we have to follow:
- Click on Add an activity | Choice.
- Complete the Choice name and Introduction text blocks.
- Write YES in the Option 1 block and NO in the Option 2 block.
- Tick the block Restrict answering to this time period and choose the Open and Until date that you are going to poll your students.
- Within the Miscellaneous Settings blocks, click on the downwards arrow in Allow choice to be updated and choose No, so that students cannot change their choice.
- Click on Save and return to course, the choice looks as shown in the following screenshot:
After polling our students, we design the chart and insert it in our Moodle course in order to design another activity. We enter http://www.editgrid.com/workspace. These are the steps that you have to follow:
- Click on New. Click on File | Save | Write a name to the file | Within the Access level, choose Public Read - only.
- Complete the spreadsheet in order to design a chart afterwards. Select the fields you want to design the chart. Click on the Insert Chart icon.
- Choose XY Scatter and choose the one type you want to work with. Click on Insert.
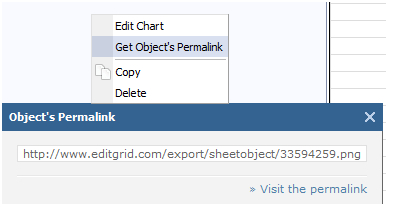
- The chart is shown on the spreadsheet. If you right-click on the chart you can edit it and have the Object's Permalink where you can have access to the chart making a link to a website, as shown in the following screenshot:
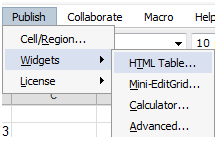
- You can also embed the chart in the Moodle course. Click on Publish | Widgets | HTML Table, as shown in the following screenshot:
- A pop-up window will appear with the HTML code to copy and paste in our Moodle course.
You can create a Forum activity, embedding the chart in which students post their comments about their holidays abroad.