
DANIEL E. GALLEGOS
Principal, Barclays Global Investors
CHRIS BARR, CFA
Principal, Barclays Global Investors
Abstract: Unlike equities, most U.S. fixed income securities are traded over the counter, not on formal exchanges like the New York Stock Exchange. This convention, combined with the large number of debt issues outstanding, is largely responsible for the lack of price transparency that exists in the fixed income markets. Poor transparency contributes to investor differences in bond valuations as well as other inefficiencies that may lead to economic losses for market participants and ultimately inhibit business development. To address the inefficient nature of fixed income pricing, the bond market has evolved, aided by advances in technology, innovations in pricing methodologies, and modification of regulatory requirements.
Keywords: price transparency, bid/offer, price indications, multidealer-to-client electronic platforms, Trade Reporting and Compliance Engine (TRACE), Municipal Securities Rulemaking Board (MSRB), Real-time Transaction Reporting System (RTRS), matrix pricing, best execution, fiduciary, option-adjusted spread (OAS)
In this chapter, we discuss the benefits of price transparency for investors, the causes and effects of poor price transparency in the major fixed income sectors, arguments that support and oppose further transparency, and a few key elements of these markets that continue to undergo significant changes.
Price transparency can be defined as the extent to which information is available to easily establish the correct market value of a security. It is important for a variety of reasons. For individual investors, transparency gives the market participant reassurance that they were fairly charged for a particular security. For institutional investors, it can help fulfill fiduciary duty by reducing costs and ensuring accuracy in performance reporting. For the market in general, price transparency helps increase activity, which in turn fosters participation, liquidity, and new product development.
Transparency has allowed for great precision in attributing skill in markets such as equities, where the value of stock selection or of a particular portfolio strategy is borne out readily by virtue of indisputable price identification. The bond market, however, has historically been plagued by unclear pricing, making it more difficult for market participants to conduct trades efficiently, let alone assess their worth. In fact, it has been a topic of concern since the inception of fixed income trading in the early 1900s, and has intensified over the last decade or two.
Unfortunately for investors, the nature of the bond market lends itself to price ambiguity. Fixed income is a principal market that operates on Wall Street's terms: broker/ dealers buy at the bid and sell at the offer. Investors abide by these terms as they buy at the offer side and sell at the bid side. Although corporate and municipal bonds traded on exchanges in the early 1900s, the market has long since been characterized by dealer bid/offer facilitation and subsequent price opaqueness. For years, bond managers have complained about the inefficient nature of pricing bonds: manually calling multiple brokers for price indications on whole portfolios (with markets open and prices moving) while their equity counterparts effortlessly garner unambiguous valuations from the financial website of their choosing. Or worse, going to sell a bond position only to find the mark is "stale" and no longer worth what the custodial report quoted.
The Texan artist Jack White once said, "Art is only worth what people will pay for it." If a quote from history is worth a page of logic, then the bond market, like life, imitates art—the price of a bond should reflect what someone is willing to pay for it. The problem is that many bonds do not trade frequently enough to accurately know what people will pay for them. For example, a look at the National Association of Securities Dealers (NASD) trade histories for the constituents of the Lehman Brothers U.S. Corporate Index shows that only a little over half of the line items had traded during the previous day. And these are not small issues; the index rules require a minimum issue size of $250 million.
So if a trade price is not available, why not just do the bond math to get a market valuation? After all, a bond is nothing more than a future stream of cash flows—discount each one of those flows by some prevailing rate, add them up, and voila! the result is a bond price that everyone can agree on.
In theory, this should work if the assumptions regarding the prevailing discount rate are shared. In some cases they are. U.S. government securities—Treasuries, for example—trade very close to the theoretical value calculated from readily available interest rate information that, for the most part, everyone can agree on. In fact, Treasuries are so transparent that other bonds, like corporates, are priced according to their yield spreads.
This is the point at which different levels of transparency can be observed. Although the Treasury yield is transparent, this corporate "credit spread" represents the additional yield the investor requires above and beyond a "riskless" Treasury rate to compensate for the risk that the bond issuer may default on the obligation. The spread may vary for different sizes, structures, and maturities, and therefore it may be subject to interpretation. In addition, the bond may include embedded options, such as call or prepayment provisions, covenants, restrictions, and esoteric cash-flow structures, all of which change the complexion of the bond and require assumptions regarding creditworthiness, interest rate volatility, prepayment behavior, and liquidity. Each of these variables entails assumptions that give rise to different levels of price transparency.
But many bonds do seem to have transparent pricing. U.S. Treasuries trade throughout the day at levels quoted electronically: what you see on the broker screens is what you get in the markets. Or is it?
Case in point: Institutional investors are typically offered Treasuries significantly cheaper than those offered to individual investors. The difference in offering prices is easily observed on two quoting sources: a retail brokerage account and an institutional quote system. And even that price may vary owing to the size and nature of the trade (odd-lot or block order, agent or principal). In fact, different levels of price transparency exist in each of the major fixed income sectors: government, mortgage, corporate, and municipal.
Much of the lack of transparency within each of the fixed income sectors is a function of liquidity—it is hard to accurately assess the market value of a bond if the market is not active. Figure 44.1 provides average daily trade volume for the different sectors of the Lehman Brothers U.S. Aggregate Bond Index, arguably the most popular benchmark for U.S. fixed income strategies. As the graph suggests, there are dramatic differences in liquidity between sectors. Many names do not typically trade on a daily basis, and some do not even trade weekly. By contrast, virtually all of the stocks in the Russell 3000 Index, a broad-capitalization equity benchmark, trade at least daily, with the average stock trading more than a million shares per day.
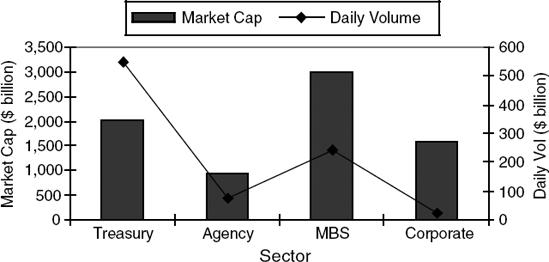
Figure 44.1. Lehman Brothers U.S. Aggregate Bond Index as of 9/30/2006: Market Capitalization versus Daily Volume Source: The Bond Market Association, "Average Daily Trading Volume in the US Bond Markets," September 30, 2006.
To gain insight into this liquidity spectrum, we can compare the major fixed income sectors. But it's important to keep in mind that, within each of these sectors, there exists at least one subsector whose price transparency varies widely from the others.
U.S. Treasury and agency securities are perceived to have the greatest liquidity and price transparency in the fixed-income markets. Despite the complexities of many government bond structures, (roughly half of the agency bonds in the Lehman Aggregate are callable), this sector has always enjoyed the highest degree of price transparency, largely due to the guaranteed status (implied or actual), and it trades over $600 billion per day. In fact, the U.S. government market was the first to raise the curtain on pricing when, in 1991, a 24-hour global electronic reporting system called GovPX was developed for U.S. Treasury and other government securities. But investors were really rewarded in 2000 when a syndicate of 18 broker/dealers joined to form an electronic dealer-to-customer auction platform called TradeWeb, where executable bids and offers are clearly and unambiguously listed for all subscribers to participate. According to TradeWeb, virtually all of the Treasury market and much of the Agency market can currently trade electronically.
Unlike Treasuries, whose average issue size in the Lehman Aggregate is around $15 billion, the average size of a corporate bond in the same index is about $600 million, and it trades far less frequently. Despite this relative gap in liquidity, significant changes to the corporate bond market over the past few years have fostered increased price transparency. Like governments, corporates now have venues to trade electronically. Multidealer-to-client electronic platforms (such as MarketAxess) allow "best bid/offer" facilitation for the credit markets, contributing a valid source of accurate price dissemination. Electronic coverage of the corporate market, however, is not as comprehensive as the government market. Only 12% of the investment-grade corporate market trades are done by electronic execution, totalling roughly $3.6 trillion a year, according to MarketAxess.
The credit derivative market also plays a pivotal role. Credit default swaps (CDSs), designed to transfer the credit exposure of fixed income products between parties, are the most widely used credit derivatives, and represent a revolutionary way of gaining transparency in the credit markets. Since many corporate bond investors are only interested in accessing a debt issuer's credit risk (the compensation received in the form of credit spread), the $5+ trillion CDS market is fertile ground for eliminating price ambiguity from issuers with multiple maturities, coupons, and structures. After all, a $600 million 6% coupon Ford bond should be no more or less creditworthy than a $3 billion 7% Ford bond. In fact, many believe the CDS market leads the cash markets in corporate price relevance.
But the biggest improvement in corporate price transparency came as a result of the evolution of the NASD's Trade Reporting and Compliance Engine (TRACE) program. TRACE facilitates the mandatory reporting of over-the-counter secondary-market transactions for eligible fixed-income securities by requiring brokers to report trades on eligible bonds to the TRACE system within 15 minutes. With the hopes of providing better price transparency to the market, all broker/dealers who are NASD member firms have an obligation to report transactions in corporate bonds to TRACE under a Securities and Exchange Commission (SEC)-approved set of rules. TRACE became operational on July 1, 2002, and now encompasses 95% of all corporate issues according to the NASD.
The TRACE system has made great strides, but price inconsistencies still exist. Substantial disparities can be observed on TRACE for even the largest and most liquid issues, owing primarily to trade size (unlike the equity markets, bond liquidity typically increases with trade size). And as mentioned above, the method for establishing corporate bond prices (evaluating the creditwor-thiness of the issuer and then assigning different probabilities for receiving the cash flows which the bond is structured to pay) can be an analytically intensive process which few investors have the resources to accomplish, and with ample disagreement among those who can. Just like Treasuries, institutional investors receive more favorable pricing than individual investors, and large differences in corporate prices can be realized depending on the counterparty. Furthermore, a study by Edwards, Harris, and Pi-wowar (2005) suggests that liquidity (hence transparency) also decreases with quality, especially as ratings drop below BBB into high yield. A review of the NASD trade histories for the constituents of the Merrill Lynch High Yield Index reveals that only about one-third trade every day.
While the TRACE system represents a significant step toward increased price transparency in the fixed income markets, it does not apply to all sectors, especially the largest sector: mortgage securities.
Representing more than 35% of the Lehman Brothers U.S. Aggregate Bond Index's nearly $9 trillion market capitalization, mortgage-backed securities (MBSs) make up the largest sector of the fixed income market. The mortgage markets are made up of many distinct security types, each having their own level of transparency. Generalizations regarding the ease of pricing cannot be made, regardless of the security descriptive characteristics. The same sophistication that is needed in determining expected cash flows in the corporate markets applies to the MBS sector. However, in addition to creditworthiness, the probability of principal prepayment must be understood and projected.
As a whole, the mortgage markets experience the greatest amount of deviation in terms of price transparency. Agency TBAs (generic "to be announced" pass-through securities issued by Ginnie Mae, Fannie Mae, and Freddie Mac) enjoy the same liquidity as Treasuries, with trillions of dollars traded electronically (also on TradeWeb). Many derivatives structures, like collateralized mortgage obligations (CMOs), are created from mortgage pools. Since the structures derive their value from the underlying collateral, the sensitivity of pricing to prepayment assumptions can be magnified. And finally, when the additional level of credit complexity must be accounted for, as found in whole loan or private-label subordinate notes, it is difficult for even the most sophisticated investor to price these securities.
The municipal market has long been the poster child for bad behavior in price transparency. In fact, a 2004 study by the SEC showed individual investors typically faced bid/offer spreads of nearly 2% for average municipal bond trades—almost 100 times larger than U.S. Treasury spreads! This is due primarily to the facts that municipalities have myriad liquidity and creditworthiness factors for their more than 1.5 million issues, their markets are highly fragmented and regionalized, and they are characterized by relatively low trading volumes. The Municipal Securities Rulemaking Board (MSRB), however, has been instrumental in facilitating increased price transparency by requiring publicly disseminated trade information on par with TRACE. Since January 2005, the Real-time Transaction Reporting System (RTRS) receives municipal trade reports within 15 minutes of execution.
There are a number of other structures, including those that utilize leverage, exhibiting various levels of price transparency. Structured credit products such as collateralized debt obligations (CDOs)—collateralized bond obligations (CBOs) and collateralized loan obligations (CLOs)—have become increasingly popular, and derive their value from underlying collateral and cash-flow priority. The complexity and limited liquidity of these structures restrict their transparency to all but a select group of sophisticated analysts, but this is changing due to growing interest from participating investors.
There is no doubt that actual transaction data could provide the most certainty for deriving the fair value of a security. However, because some fixed income securities trade so infrequently, and transaction data may be too stale to be relevant, many third-party vendors exist to supply investors with bond prices based on a variety of sources and methodologies. Each of these may establish prices using different methods, the most common of which include market indications, matrix pricing, and option-adjusted spread (OAS) calculations.
Talking directly to brokers for dealer quotes is a reliable way to establish price transparency by removing ambiguity. This method is performed simply by calling brokers and trade participants who specialize in specific sectors of the market and soliciting indicative bids and/or offers for a particular lot size. This could very well be the most-time-consuming method used to derive fair value. But in many ways, it offers the best sense of price transparency for those securities that trade infrequently, as the broker will ostensibly be providing an indication of interest.
A drawback to this method is that these price levels are not necessarily firm indications as to where the bonds might trade, but rather a best guess of the securities' market value. The indications may also vary according to who is making the inquiry. A large transactional investor, for example, will likely receive more accurate indications than a small, infrequent investor. And of course it may be prohibitively time consuming, rendering it impractical for large portfolios.
A matrix-pricing system is another method in which indicative prices can be established. Matrix pricing makes it possible to price a large number of bonds within a short period of time. It also has the added benefit of providing indicative price capability for bonds that are thinly traded. This is accomplished by using a liquid subset of bonds from which to extract indicative spread data.
A pricing matrix is constructed using recent execution data; from this data, credit spreads to specific benchmarks are created and updated as new data become available. For this to be effective, bonds are segregated by characteristics such as sector, industry, term, rating, size, and so on. Once spread levels have been stratified, like bonds can be priced relative to a rate benchmark, such as Treasuries, using the matrix. Though this method is not as accurate as real-time execution levels, price changes attributable to spreads tend to be lower than changes attributable to rates, making it an appropriate tool for creating general price indications.
What matrix pricing neglects to consider are the security-specific risks associated with individual issuers, such that the spreads used to build the matrix may not reflect the actual securities priced from them. Also, matrices may have stale values that do not accurately reflect the current market environment for various structures. And finally, the more esoteric structures, such as derivatives or levered securities, may be wildly mispriced on these systems owing to even the slightest structural differences that cannot be captured with the limited amount of granularity within a particular matrix.
Whereas a matrix can offer indications of spreads attributable to sector, industry, rating, and maturity, option-adjusted spread (OAS) calculators are often used to price bonds with embedded options. Option value is a function of many variables, some fairly intuitive, others more complex. The value of a simple European call option, for example, is predominantly a function of strike, term, and volatility. These factors are easily accessible and are routinely incorporated into binomial lattice models. Since the assumptions regarding the time and level of exercise tend to be binary (that is, corporations are assumed to call an obligation any time it makes economic sense to do so), there tends to be, for the most part, only modest variance in plain-vanilla option valuation. Prepayment options, on the other hand, like those found in MBSs, must include not only rate factors but also behavioral assumptions regarding prepayments, which may be far less uniform and frequently incorporate complex stochastic interest rate-path-generating models that represent an enormous barrier to transparency for the average investor. Even though many securities require the input of an OAS calculator, this is a technical tool, and one that is demanding of specialized skill.
Although it may seem clear at first glance that transparency is a good thing for all securities markets, there are two sides of the debate for bond market participants.
The primary reason for increasing the level of price transparency in the fixed income markets is to protect the investor from buying or selling a security at a price that is materially different from its true market value. It is not uncommon to find a news story about an unscrupulous broker taking advantage of an uninformed retail investor.
And although institutional investors are better equipped than individual investors to address the market inefficiencies that riddle the bond market, poor price transparency can negatively impact any portfolio's performance in the form of transaction costs. This is of particular importance to institutional money managers bound by the fiduciary responsibility oibest execution (more on the concept of best execution below).
Just how negative is the impact of poor transparency? In 2005, armed with TRACE data, the SEC staff in the Office of Economic Analysis studied transaction costs before and after transaction reporting and concluded that for the period observed, costs were 5 basis points lower overall with price transparency. Further, $1 billion could have been realized by investors if all bonds were transparent for the whole year, suggesting increased transparency had cut some costs almost in half! While spreads are indeed a function of more than just price transparency, there appears to be evidence to support the hypothesis that transparency reduces costs.
The benefits of price transparency, however, are greater than just reduced transaction costs. Timely dissemination of accurate price information can help all investors value individual securities, evaluate investment strategies, and objectively monitor performance. Also, higher levels of price transparency can only help foster investor confidence, encouraging higher bond market participation from the small U.S.-based individual investor to the large international institutional investor. Lifting the fog on bond prices would likely spur an increase in market efficiency and new product innovation while deterring improper trade practices.
Brokerage trading desks make money primarily by providing liquidity, either consistently (through flow trading) or opportunistically (with proprietary trading). The difference is subtle, but it offers some insight as to the motivations of some market participants who oppose better transparency.
If the desk's goal is solely to maximize profit opportunistically, there is a clear incentive for a trader to bid low and offer high, without being so far off the perceived market as to scare away investors. Therefore the less transparency there is for the "perceived market," the more the trader is advantaged by the lack of information. The business model for this type of desk is based on the premise that inefficiencies can be effectively exploited by staying ahead of the competition, continually buying low and selling high.
An opponent of better transparency might argue, "Why is it that in other industries in which those who take risks and are able to identify unrealized value are entitled to commensurate rewards?" A broker's logic supporting this argument is that publicized trade prints (that is, the TRACE program) advertise exactly where a bond trades to the next potential buyer, leaving inadequate room for even a minimal markup, and leaving the broker holding the risk without receiving upside compensation, further adding insult to injury. Some dealers argue that if they can no longer mark up to where they feel they are being fairly compensated, liquidity will subsequently dry up. The NASD is proposing "contemporaneous cost" rules to regulate dealer markups (the current regulatory guideline generally limits markups to 5% with justification).
While the arguments for both sides of the debate continue, the trend toward increasing price transparency has not halted.
The march toward increasing price transparency in the fixed income markets has brought about a sea change in the way bonds are viewed and traded. Among those elements that are rapidly evolving, it is reporting, best execution practices, and various trading methods that are undergoing significant changes.
As investors are becoming more aware of the consequences of inadequate price transparency, analysis of the execution data has become much more rigorous and informative, and various methods of evaluating the execution data are being demanded from investors.
To accommodate this demand, many electronic trading platforms are developing reports to evaluate the effectiveness of bond traders and the price levels being offered. Some of the methods of evaluation include comparing executions versus composite levels, percentage use of particular brokers, and evaluations of whether the best price was achieved for each execution. This is done in the hopes of both increasing transparency as well as evaluating the source responsible for the execution. Such methods of evaluation and increased scrutiny have dictated the development of third-party evaluation systems and the establishment of best execution committees.
Most asset managers and fiduciary trade execution providers have adopted so-called best execution practices that govern their daily trading procedures by committing them to pursue the most favorable price in the market at the time of the trade. Best execution requires market participants to use reasonable due diligence to ensure customers receive favorable prices under prevailing market conditions.
Often used to source liquidity is the auction process. An auction process is a trading method that sources numerous counterparties' price indications simultaneously (detailed below). Best execution practices can also include the strategy of engaging a single source of liquidity as opposed to multiple providers, depending on the expected impact caused by the trade strategy. Best execution is not a performance guarantee; rather, it helps define a consistent approach to sourcing liquidity.
In order to alleviate the risk of executing a security at a value that differs greatly from its true market value, many institutional traders have adopted the use of an auction-style trade process. This process offers the advantage of seeking liquidity from multiple sources with the intent of better targeting the most interested parties.
Historically this process, known as "bid wanted in comp," was prohibitively time consuming, as bid lists were communicated by fax, and solicitations were made one at a time by telephone. However, the auction style is again becoming more widely used among most of the electronic trading platforms, and for those securities that are not traded on electronic venues, investors are creating systems to allow the same process to take place. It has been proven that this method provides the greatest amount of transparency into the current market and allows sellers and buyers to have increased confidence in their execution levels.
Finally, in an effort to improve liquidity and transparency, the NYSE Group received SEC approval of exemption to trade unlisted debt securities, adding nearly 6,000 bonds to its current inventory.
Price transparency can be defined as the ability to easily establish the correct market value of a particular security. This is not always an easy task because different levels of price transparency exist in each of the major fixed income sectors. And within each of these sectors, there exists at least one subsector whose price transparency varies widely from the others. Though it may be easy to establish or obtain an indicative price level on a security, this doesn't necessarily mean that the price reflects the true market value.
To help address these issues, many pricing sources are now available, each of which establishes prices using a different method. Some of the more common methods include: matrix pricing, option-adjusted spread (OAS) calculators, price talk indications, and execution data. Not all of these methods are based on current trade data, and because of this, the development of systems like the NASD's TRACE program (which provides immediate trade transparency on eligible securities) is particularly significant.
Arguments are made both supporting and opposing the increase of bond market price transparency. Bond pricing continues to become more transparent, however, aided by advancements in technology, innovations in pricing methodologies, and changes to regulatory requirements. As this continues, investors will be equipped with more information with which to base decisions and more opportunities to add value. After all, as Warren Buffett once said, "Price is what you pay. Value is what you get."
Bessembinder, H., Maxwell, W., and Venkataraman, K. (2006). Market transparency, liquidity externalities, and institutional trading costs in corporate bonds. Journal of Financial Economics 82: 251-288.
Bloomfield, R., and O'Hara, M. (1999). Market transparency: Who wins and who loses? Review of Financial Studies 12,1: 5-13.
Chakravarty, S., and Sarkar, A. (2003). Trading costs in the U.S. corporate, municipal and Treasury bond markets. Journal of Fixed Income 13,1: 39-48.
Chen, L., Lesmond, D. A., and Wei, J. (2004). Corporate yield spreads and bond liquidity. Working paper.
Chordia, T., Sarkar, A., and Subrahmanyam, A. (2005). An empirical analysis of stock and bond market liquidity. Review of Financial Studies 18,1: 85-130.
Edwards, A. K., Harris, L. E., and Piwowar, M. S. (2005). Corporate bond market transparency and transaction costs. Working paper.
Green, R. C, Hollifield, B., and Schiirhoff, N. (2004). Financial intermediation and the costs of trading in an opaque market. International Center for Financial Asset Management and Engineering. Research paper no. 130.
Hong, G., and Warga, A. (2000). An empirical study of bond market transactions. Financial Analysts Journal 56, 2: 32-46.
Hotchkiss, E. S., and Ronen, T. (2002). The informational efficiency of the corporate bond market: An intraday analysis. Review of Financial Studies 15, 5: 1325-1354.
Kalimipalli, M., and Warga, A. (2002). Bid/ask spreads, volume and volatility in the corporate bond market. Journal of Fixed Income 11, 4: "31-42.
Levitt, A. (1998). Testimony of Chairman Arthur Levitt Before the House Subcommittee on Finance and Hazardous Materials, Committee on Commerce, Concerning Transparency in the United States Debt Market and Mutual Fund Fees and Expenses, September 29. Retrieved from www.sec.gov.
Schultz, P. (2001). Corporate bond trading costs: A peek behind the curtain. Journal of Finance 56 (April): 677-698.