
Understanding What PivotTables Are and What You Can Do with Them
A PivotTable is a special kind of report that rearranges the fields and records in a table into a different order so that you can examine their relationships. You pivot (in other words, rotate) the columns in a PivotTable to display the data summarized in a different way.
For example, take a look at the worksheet shown in Figure 12–1. This worksheet contains a data table that tracks sales made by a company with four product lines: Hardware, Software, Services, and Supplies. The table uses the following columns:
- Sale. A unique sequential number used to identify each sale.
- Year, Month, and Day. The year, month, and day of the sale. Having these items in separate columns makes it easier to filter by time—for example, to compare one month against another or to see which salesperson sold what in January.
- Salesperson. The name of the sales rep who executed the sale.
- Line. The product line of the product sold.
- Product. The name of the product sold.
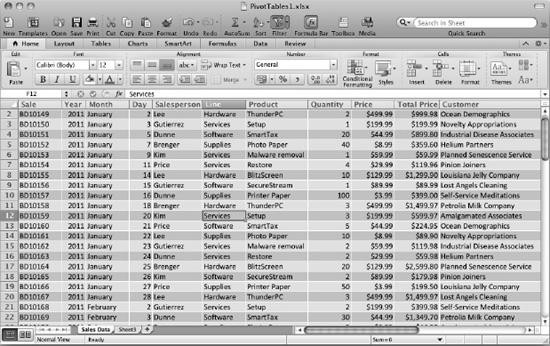
Figure 12–1. The sample table we'll use for creating PivotTables in this chapter
- Quantity. The quantity of the product sold.
- Price. The unit price of the product sold.
- Total Price. The total price of the products sold (Quantity multiplied by Price).
- Customer. The name of the company or organization that bought the products.
This is all straightforward, and you can use a data-entry form to add the data to the data table or edit existing records. You can also easily see your sum total of sales (for example, by adding the figures in the Total Price column). But when you need to dig into the details, you need a different tool.
This is where PivotTables come in. By creating a PivotTable from a data table such as this, you can quickly find the answers to questions such as these:
- Which is your best-selling product line? And your best-selling product?
- How do this year's sales compare to last year's?
- Who was your star salesperson for March? And does another salesperson need some encouragement—or a pink slip?
- Which are your key customers? Which of them needs more one-on-one attention to bring sales up to where they were last year?
In the following sections, we'll put together a PivotTable with the data in the data table, then manipulate it to see what it shows.
NOTE: If you want to work through the examples in this chapter, you'll need a database table like the one shown in the screens. You can either create one yourself or (much easier) download the sample workbook from the book's page on the Apress Web site (www.apress.com).