
Using Your Charts in Word Documents and PowerPoint Presentations
Excel is Office's application for creating charts, but you will likely also want to use charts to illustrate Word documents and PowerPoint presentations. You can either reuse a chart you've already created in Excel or create a new chart especially for that document or presentation.
Understanding How You Can Add a Chart to a Document or Slide
A chart can be a great way of presenting complex or detailed information in a manner that's instantly clear in a document or on a slide. You can add a chart to a Word document or a PowerPoint presentation in either of these ways:
- Create a chart on an embedded worksheet. Click the Charts tab of the Ribbon, then choose the chart type by using the pop-up buttons and panels in the Insert Chart group. Word or PowerPoint then opens Excel for you and creates a new workbook so that you can enter the chart data and create the chart. The workbook is embedded in the Word document or PowerPoint presentation, so it becomes part of that file.
NOTE: In PowerPoint, you can also click the Insert Chart icon in a content placeholder to start creating a chart on an embedded worksheet.
- Copy a chart from an Excel workbook. Create your chart in Excel using the techniques described earlier in this chapter, then copy the finished chart and paste it into the Word document or onto the PowerPoint slide. You can choose whether to embed the chart's data in the Word document or PowerPoint presentation or just to insert the chart as a picture or PDF file.
Here's how to choose when to create a new embedded workbook, embed an existing workbook, link back to a workbook, or insert a picture:
- Create a new embedded workbook. Do this when you don't yet have the data for the chart in Excel and you need to keep the chart's data with the Word document or PowerPoint presentation. For example, you'll send the presentation to someone else who will need to work on the chart data too.
- Embed an existing chart and its data. Do this when you have the data for the chart or the chart itself in a workbook in Excel and you need to keep the chart's data available in the Word document or PowerPoint presentation. After embedding the chart and its data, you can open the chart from Word in Excel and edit it there.
- Link back to a workbook. Do this when you want to be able to change the chart or its source data in Excel and then automatically bring those changes into Word or PowerPoint by updating the chart. Linking requires the workbook to stay in the same relative place in the computer's file system to the document or presentation so that Word or PowerPoint can find the updated data. Moving the document or presentation to a different computer breaks the link.
CAUTION: Linking a chart can be great when it works—but links can fail at the most awkward times. Before giving a presentation that includes linked charts, double-check that the links are working. That way, you'll have a chance to fix any problems rather than discovering them when your audience sees them.
- Insert a picture. Do this when you don't need to keep the connection between the chart and its source data and you will not need to edit the chart in the document or presentation.
Creating a Chart in a New Embedded Workbook
To create a chart on a worksheet in a new workbook embedded in a Word document or PowerPoint presentation, follow these steps:
- Open the document in Word or the presentation in PowerPoint.
- On the document page or slide where you want to create the chart, click the Charts tab of the Ribbon. Word or PowerPoint displays the Charts tab of the Ribbon.
- In the Insert Chart group, click the pop-up button for the category of chart you want to create. For example, click the Column pop-up button to display the Column panel.
- On the pop-up panel, click the chart type. Word or PowerPoint creates a chart of that type on the slide and launches Excel, which creates a new workbook, embeds it in the document or presentation, and gives it a name such as Chart in Microsoft Office Word or Chart in Microsoft Office PowerPoint.
- Change the chart range and the sample data (Figure 7–16 shows an example using PowerPoint) to the data your chart needs. Word or PowerPoint automatically updates the chart to match the data in the Excel worksheet.

Figure 7–16. Excel enters sample data on the first worksheet in the embedded workbook. Change this data to create your chart.
- When you have finished changing the data, close Excel. For example, click the Close button (the red button at the left end of the title bar) or choose
Excel
QuitExcel.NOTE: Excel saves the data in the embedded workbook automatically, so you don't need to save it while you're working in the Excel window.
- Use the controls on the Charts tab and the Chart Layout tab of the Ribbon to format the chart the way you want it. Figure 7–17 shows a PowerPoint slide containing a chart with formatting under way.
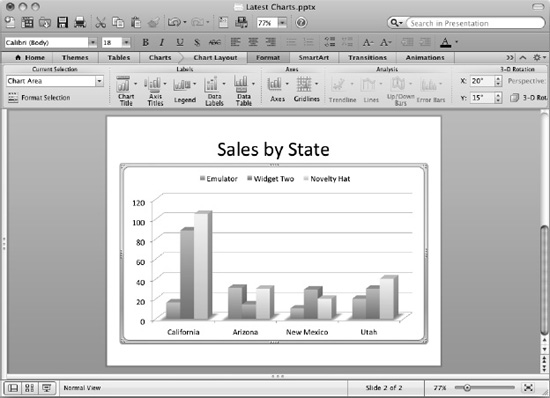
Figure 7–17. After inserting a chart using an embedded workbook, use the controls on the Charts tab and the Chart Layout tab of the Ribbon in Word or PowerPoint (shown here) to format the chart.
- Save your Word document or PowerPoint presentation.
NOTE: To edit the data on your chart again, choose Charts ![]()
Data ![]()
Edit from the Ribbon, clicking the main part of the Edit button. Word or PowerPoint opens Excel, which displays the embedded worksheet.
Pasting a Chart from Excel into a Word Document or PowerPoint Slide
If you have a chart already created in Excel or if you have a workbook containing the data from which you will create the chart, you can paste the chart into Word or PowerPoint. Follow these general steps:
- Create the chart using the techniques explained earlier in this chapter.
- Click the chart to select it.
- Copy the chart to the Clipboard. For example, click the Copy button on the Standard toolbar or press Cmd+C.
- Switch to Word or PowerPoint, then navigate to the document or slide on which you want to insert the chart.
- Paste in the chart from the Clipboard. For example, click the Paste button on the Standard toolbar, or press Cmd+V.
- Click the Paste Options button at the lower-right corner of the chart, then click the appropriate option button in the upper group on the Paste Options pop-up menu (see Figure 7–18):
- Chart (linked to Excel data). Select this option button to link the chart back to the Excel workbook it came from.
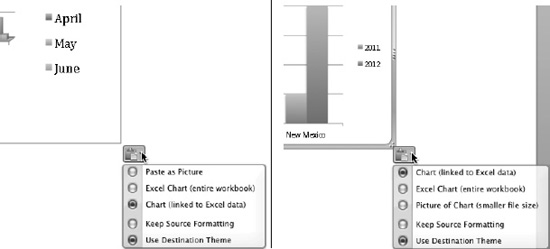
Figure 7–18. When pasting a chart from Excel into a Word document (left) or PowerPoint slide (right), click the Paste Options button, and use the option buttons on the pop-up menu to choose how to paste the chart.
- Excel Chart (entire workbook). Select this option button to embed the entire Excel workbook in the PowerPoint presentation.
- Paste as Picture (Word) or Picture of Chart (smaller file size) (PowerPoint). Select this option button to insert a picture of the chart. As the PowerPoint name says, inserting the picture helps keep the presentation file size down, but you can't edit the picture.
- Chart (linked to Excel data). Select this option button to link the chart back to the Excel workbook it came from.
- If you want the chart on the slide or in the document to use the original formatting you gave it in Excel, click the Paste Options button again, then select the Keep Source Formatting option button. Otherwise, leave the Use Destination Theme option button selected, and the chart will pick up the formatting from the document or presentation.
- Use the controls on the Charts tab or the Chart Layout tab of the Ribbon to format the chart the way you want it. (If you inserted the chart as a picture, use the controls on the Format Picture tab of the Ribbon.)
- Save the document or presentation.
To edit the data in either an embedded or linked chart, choose Charts ![]() Data
Data ![]() Edit, clicking the main part of the Edit button.
Edit, clicking the main part of the Edit button.