In this recipe, we are going to perform a very simple activity. We are going to use Open Office Spreadsheet, which we have already used before. Another option happens to be Microsoft Excel. You can download a free trial version from the following website: http://tinyurl.com/27xe849.
We design a Database activity in our Moodle course to survey students according to the way they spend their free time. We just carry out a simple statistic; we are not focusing on other factors, though a Math teacher can help us. We design this activity in two parts so that the first part is the survey to our students and the second part consists of gathering the data and designing a chart using Open Office Spreadsheet, creating the hyperlinks through a website, and uploading it to our Moodle course.
We are going to enter our Moodle course and design the database activity in order to gather information about the way our students spend their free time. Select the weekly outline section and follow these steps in order to develop the activity:
- Click on Add an activity | Database.
- Complete the Name and the Introduction fields.
- Choose 1 in Maximum entries.
- Click on Save and display.
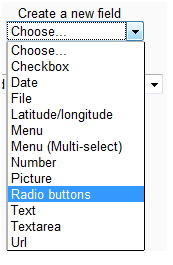
- Click on the downwards arrow in Create a new field and choose Radio buttons, as shown in the following screenshot:
- Complete at least three Radio buttons with free time activities that our students may perform.
- Click on Add.
- Repeat steps 5-7 at least twice. Complete the Radio buttons field with "Spending your free time at weekends" and "Spending your free time on holidays". You may decide to add any other option.
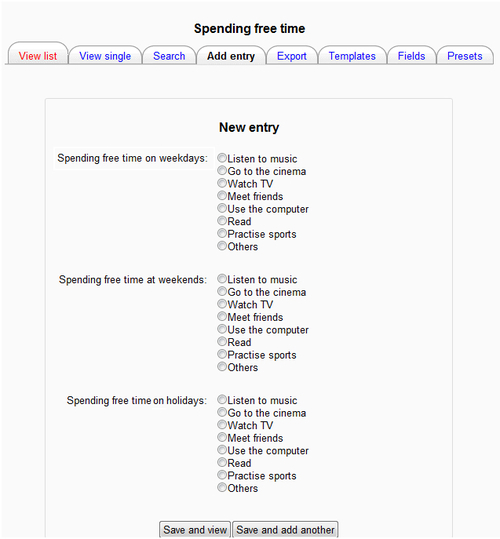
- Go back to the course. The activity looks as shown in the following screenshot:
We have just designed the survey to carry out in our class. Now, it is time to design the bar chart to insert in our Moodle course telling the rest of the class how their friends spend their free time on the different occasions. We are going to work with Open Office Spreadsheet. Follow these steps so that you can design the activity:
- Complete the spreadsheet with the information that you obtain from the database activity from the Moodle course.
- Select the first group of columns with the figures, click on Insert | Chart, and choose a graph.
- The chart will appear. You may edit the chart as you wish.
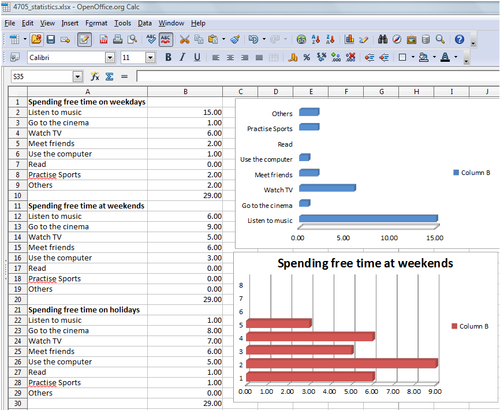
- Save the file. The file looks as shown in the following screenshot:
We can insert hyperlinks in the chart that we have just created using a website because it is not possible to do it in Open Office Spreadsheet. Therefore, we are going to save the charts as images. There are several ways to do this. The simplest way is to press the Print Screen key and paste the image in Paint or Inkscape. Cut and paste the chart where you want to add the hyperlinks and save it as .png. Repeat the same process for the other two charts.
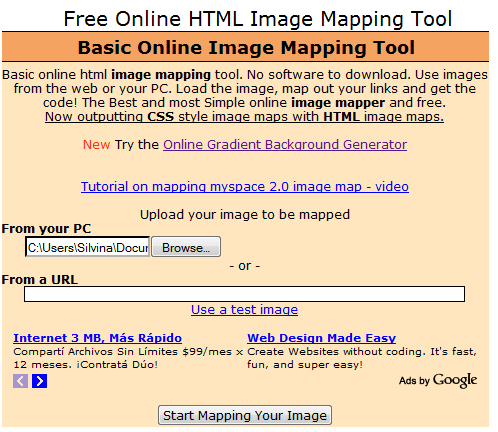
We have just saved the charts as images. Therefore, we can add hyperlinks to those images. It is very simple. We can do it through a web page: http://www.image-maps.com/. Follow these steps in order to get the hyperlinks:
- Click on Browse | choose the image that you want to upload | Open.
- Click on Start Mapping Your Image, as shown in the following screenshot:
- Click on continue to next step.
- Click on Rectangle | Drag-and-drop the rectangle that appears and forms the shape to cover the bar of the chart.
- Complete the Link for this map and Title/Alt for this map blocks.
- Click on Save.
- Repeat steps 4-6 for each bar. When you finish adding the hyperlinks, click on Get your code.
- Click on HTML Code. You will get the code to embed in our Moodle course. Search for the name of the file that you have uploaded and erase the website information; just leave the name of the file. You have to upload the image with the same name so as to have the same file in the Moodle course and in the code. It is shown in the following screenshot:
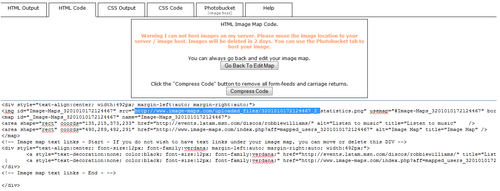
- Copy the code.
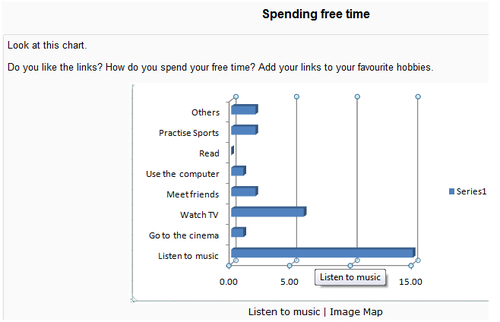
Enter the Moodle course. Create an activity for students to discuss their different likes and dislikes of their ways of spending their free time. First, upload the image to the Moodle course. Create the activity and paste the code that will display the chart with the hyperlinks. The following is an example of a chat activity. When hovering the mouse on the bar, a hyperlink is displayed: