We are going to design this activity using the following website: http://sheet.zoho.com/login.do?serviceurl=/home.do. First of all, you have to Sign Up for Free and then we can design our chart there. It is very interesting because we can embed the chart in our Moodle course.
We are not going to survey our students. We can look for online statistics about any topic, or we can upload an existing file to the aforementioned website. Therefore, we use the previous activity that we designed in Open Office and upload it to sheet.zoho.com.
You have to follow these steps in order to design the activity:
- Click on Import | Browse | Click on the file that you want to upload | Open | Import, as shown in the following screenshot:
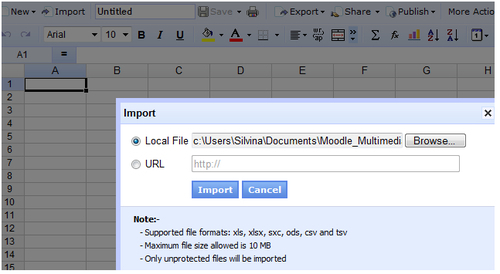
- Click on Import. The file created in Open Office will appear in this website. Create an area chart.
- Select the information in order to create the chart. Click on Add chart.
- Click on Area chart. Select the sub type and click on Next.
- Complete the Source Data block, then click on Next.
- Complete the Options block, then click on Done.
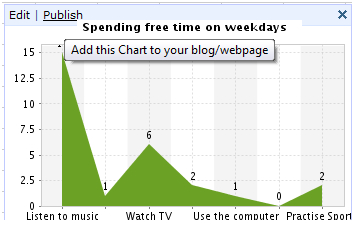
- Click on the chart. Click on Publish, as shown in the following screenshot:
- A pop-up window displaying the HTML code will appear. Click on Select Snipped, and right-click and copy the code so that we can embed the chart in our Moodle course, as shown in the following screenshot:
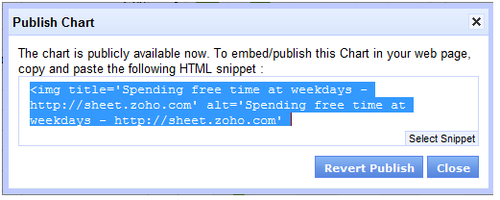
- Click on Close.
- Save the file in this: sheet.zoho.com.
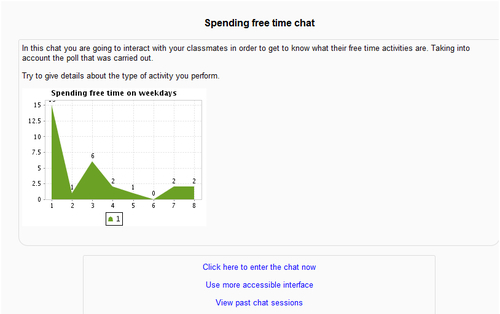
We did not create a chart in this activity because the idea was that you learned how to use an existing one and import it to another online spreadsheet. It is time to embed this area chart to our Moodle course. Therefore, we add a third element to the activity that we have first designed as a database. We are going to create a Chat activity so that there is interaction among our students and they can talk about their activities in their free time. Follow these steps:
- Click on Add an activity | Chat.
- Complete the Name of this chat room and Introduction text fields.
- Click on the HTML icon and copy the HTML code of the chart. You may embed the three charts that we have designed. In this case, you have to go back to sheet.zoho.com and copy the different HTML code for the other charts.
- Click on Save and display. The activity looks as shown in the following screenshot: