We are going to work with very interesting websites that will brighten our Moodle course. As we deal with stock charts, it is a must that we surf on the NYSE website. There happens to be a useful poster in Adobe Acrobat PDF format that can be added as a resource to our Moodle course, explaining how to read a stock chart. Then, we make a link to another website, where we can create a portfolio online, and when hovering the mouse over the name of the company, we have the stock charts of the company.
We enter http://www.nyse.com/. On the left-hand margin, there is a cascade menu where you can have access to a poster that reads: "Poster: How to Read Stock Tables". Click on About us | Education | Education Materials. There will appear new information on the right-hand margin displaying many resources concerning the stock market. We are going to use the aforementioned under Publications For Teachers.
Click on it and copy the URL: http://www.nyse.com/pdfs/NYSE_posterA_Mech.pdf .
We enter our Moodle course and choose the weekly outline section. In this case, it is a passive one, giving information about the terms related to stock tables. Follow these steps:
- Click on Add a resource | URL.
- Complete the Name field.
- Complete the Description field.
- Complete the Content field and copy the following URL: http://www.nyse.com/pdfs/NYSE_posterA_Mech.pdf.
- Click on Save and return to course.
We are going to create a Forum activity, because finance is a nice topic to discuss. We work with different links to websites that enrich the forum. You can ask the Accounts department at school for help, if you do not happen to be a finance lover, in order to interact with the said subject.
Remember to add the activity after the previous resource. These are the steps that you have to follow:
- Click on Add an activity | Forum.
- Complete the Forum name and Forum introduction blocks.
- Click on the Insert / edit image icon, and minimize the website because you do not need to use it now.
- Open your default web browser and open it in the following website: http://finviz.com/.
- Click on Maps on the top menu, as shown in the following screenshot:
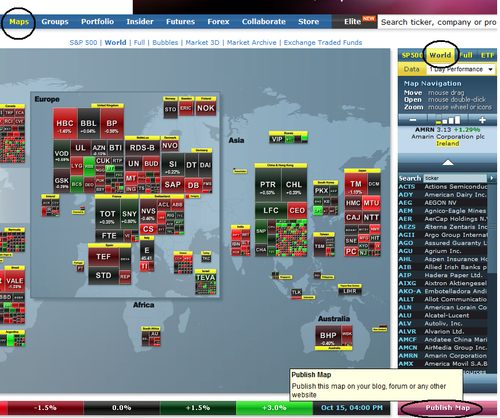
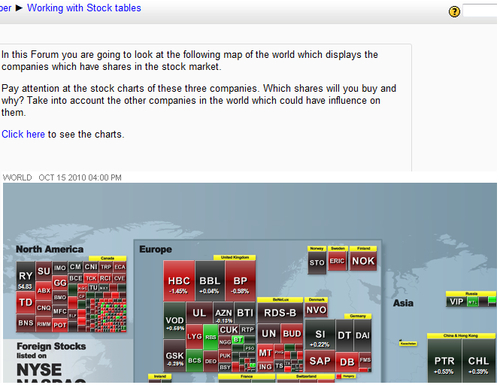
- Click on World on the right-hand side menu at the top. There will appear a map of the world displaying the names of the companies belonging to the countries with stocks. You have access to financial information about them, as shown in the previous screenshot.
- Click on Publish Map at the bottom of the right-hand of the screen, as shown in the previous screenshot. There will appear a pop-out window displaying two URLs, either for a Large map or a Small map. It's a
.PNGURL so copy it and paste it in the Insert/edit image block in our Moodle course, which we had minimized before. - Complete the Image description block and click on Insert. Minimize the Moodle course again and go back to http://finviz.com/.
- Click on Portfolio on the top menu.
- In the Ticker block, write the names of some companies, the acronyms used in the map that you have just inserted in our Moodle course.
- Repeat the same process, and when you finish, write a name to the portfolio in the Portfolio Name block. Click on Save Changes.
- Click on View. The portfolio looks as shown in the following screenshot:
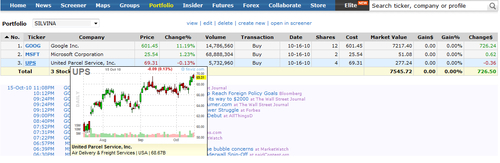
- When hovering the mouse on the name of a company, a stock chart is displayed. Copy the URL so that you make a link to this portfolio that was just created. Go back to our Moodle course.
- Click on the Insert/edit link icon and complete the block. Paste the URL that you have just copied.
- Click on Update.
- Click on Save and return to course. The activity looks as shown in the following screenshot: