
We are going to create another poll in our Moodle course. In previous recipes, we have already done a poll, but this time we design it through Feedback. We ask the students and they have to provide their answers. Let's get ready!
We design the poll using Feedback within activities, and we create the chart drawing by exporting the file from Moodle. Feedback has this advantage. The poll is related to Music. The question is: Which device do you use to listen to music?
We enter our Moodle course and choose the weekly outline section where we want to place the activity and follow these steps in order to carry out the activity:
- Click on Add an activity | Feedback.
- Complete the Name and Description blocks.
- Click on Save and display.
- Click on Edit questions on the top menu. Click on the downwards arrow within the Add question to activity block and select Short text answer, as shown in the following screenshot:
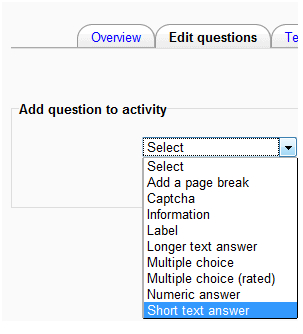
- Write the question: "Which device do you use to listen to music?" in the Question block.
- Click on Save question.
- Go back to the course.
Students will answer the poll only once. We can see the answers of the poll and we can export the files to Open Office or Microsoft Excel, and we can draw a chart using them without typing the data. Feedback generates an .xls file. The said file can be opened with either Microsoft Excel or Open Office spreadsheet, it all depends which one is used on your computer. Follow these steps in order to draw the surface chart:
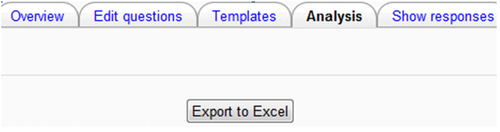
- Click on Analysis | Export to Excel (or Open Office is also possible depending on which software you use).
- A pop-up window will appear displaying a message to open the file. Click on OK.
- Save the file. Divide the listeners of music between boys and girls because you need two elements to take into account when drawing a surface chart.
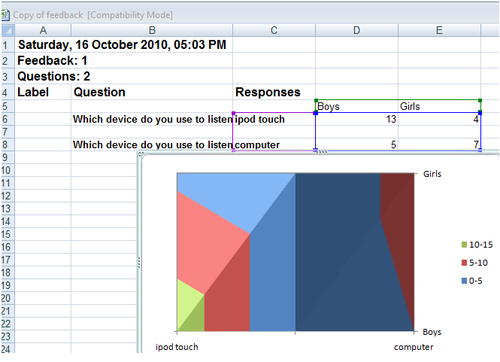
- Highlight the necessary data to draw a surface chart. Click on Insert | Other Charts | Surface (you may also use another type of chart such as bars).
- The chart may look as shown in the following screenshot:
- Right-click on the chart and select copy. Paste the chart in Paint or Inkscape and save the file as
.PNG. In that case, you can upload the image of the chart in the Moodle course and design another activity showing the students the result of the poll.
It is also possible to do it in Open Office spreadsheet if that happens to be software that you use.