
- Attach the gdb debugger with the launch file as follows:
 <launch>
  <node pkg=""chapter4_tutorials"" type=""program1"" name=""program1"" output=""screen""
  launch-prefix=""xterm -e gdb --args""/>
</launch>
- Start the ROS node within gdb debugger using the launch command:
$ roslaunch chapter4_tutorials program1_gdb.launch
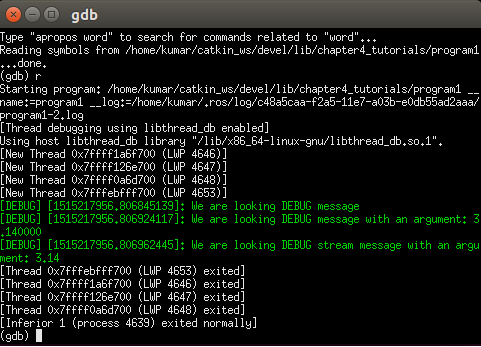
- Create a new xterm terminal with the node attached to gdb, as shown in the following screenshot.
Moreover, we can set breakpoints if needed and then press the c or r key to run the node and debug it. The source code can be listed by using the l command:
- Try debugging python in a similar way:
$ gdb python
$ run program.py
- Again, attach the gdb debugger with the launch file as follows:
 <launch>
  <node pkg=""chapter4_tutorials"" type=""program.py"" name=""program.py"" output=""screen""
  launch-prefix=""xterm -e gdb --args""/>
</launch>
Actually, ROS nodes are typically executable, but particular techniques are required to enable core dumps, which can be used in a gdb session later. First of all, we have to set an unlimited core size as follows:
$ ulimit -c unlimited
This is also required for any regular executable and not only for ROS nodes. Next, in order to create core dumps with the name and path $ROS_HOME/core.PID, we will run the following command for setting the kernel configuration using the proc filesystem:
$ echo 1 | sudo tee /proc/sys/kernel/core_uses_pid
- Start the ROS node within the gdb debugger using the launch command:
$ roslaunch chapter4_tutorials program1_dump.launch
- Load the symbol file in the gdb session upon executing the file command as follows:
gdb> file /home/kumar/catkin_ws/devel/lib/chapter4_tutorials/program1_dump
This will create a new xterm terminal with the node attached to gdb, as shown in the following screenshot. We can observe the crash message and also call the stack using the bt command. We can also call the core.pid.dump at ~/.ros directory by default:

Furthermore, we can use a similar attribute to attach the node to diagnosis tools such as Valgrind. This allows us to detect memory leaks using memcheck and perform profiling analysis using callgrind (refer to http://valgrind.org for more information):
<launch>
  <!-- Program 1 with Memory Profiler valgrind -->
  <node pkg=""chapter4_tutorials"" type=""program1_mem"" name=""program1_mem"" output=""screen"" launch-prefix=""valgrind""/>
</launch>
We will launch the example program to observe the memory leaks that have been introduced into the source code deliberately.
The Valgrind tools output the detected memory leak, as shown in the following screenshot:
$ roslaunch chapter4_tutorials program1_valgrind.launch
