ROS provides several powerful GUI tools for system introspection. First of all, we will discuss rqt_top, which shows nodes and resources they are using, which is very similar to the top command in the Linux system. The following screenshot shows the rqt_top command for the program4 and program5 nodes running in the system:

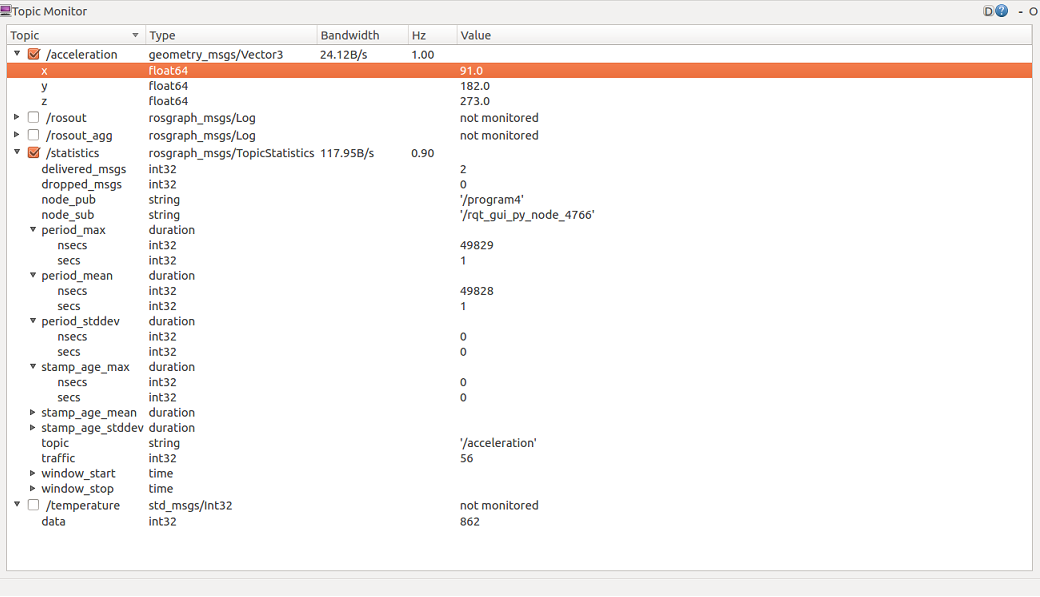
Additionally, rqt_topic provides information about the topics, which includes publishers, subscribers, the publishing rate, and the messages being published. We can view the message fields and select the topic for introspection by using the following code:
$ rosrun rqt_topic rqt_topic
The following screenshot shows the GUI and the workings of the rqt_topic tool:

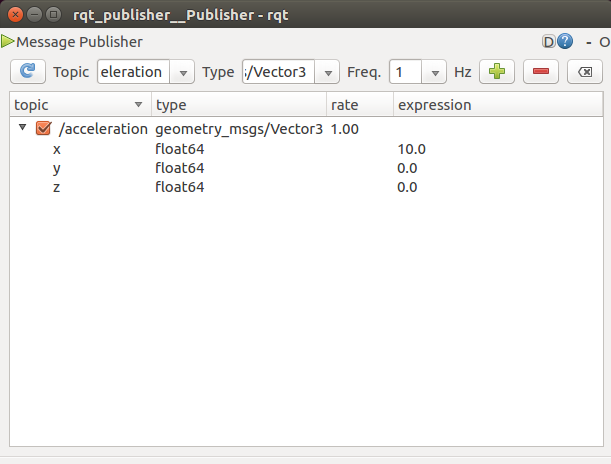
Moving forward, we can see rqt_publisher, which helps us in managing multiple instances of rostopic pub commands in a single GUI interface, as shown in the following screenshot:
Similarly, rqt_service_caller allows us to manage multiple instances of rosservice call commands in a single interface, which is shown in the following screenshot:

The current state of an ROS session can be represented as a directed graph where graph nodes correspond to the running node and edges are the publisher-subscriber connections. The ROS tool rqt_graph can be used in dynamically drawing this graph:
$ rosrun rqt_graph rqt_graph
The following screenshot shows the directed graph for our example, where program4 and program5 are running in the current session:

In the preceding screenshot, we have the program4 and program5 nodes connected by the topic's temperature and acceleration. The rqt_graph GUI provides several options for customizing the view.
Finally, we will learn how to enable statistics to observe the message rate and bandwidth. We have to set the statistics parameter before running rqt_graph in order to make this information available:
$ rosparam set enable_statistics true
Hopefully, we will get the information we need by using rqt_graph, which is shown in the following screenshot:
The ROS provides the roswtf tool, which statically analyzes a given package and detects potential problems. For chapter4_tutorials, we have the following output:
$ roscd chapter4_tutorials $ roswtf
The output is shown in the following screenshot:

In the preceding screenshot, we can observe that roswtf does not detect any errors, but even then some of them are innocuous. However, the purpose of roswtf is to signal potential problems; it is our responsibility to verify whether they are important to consider or not.
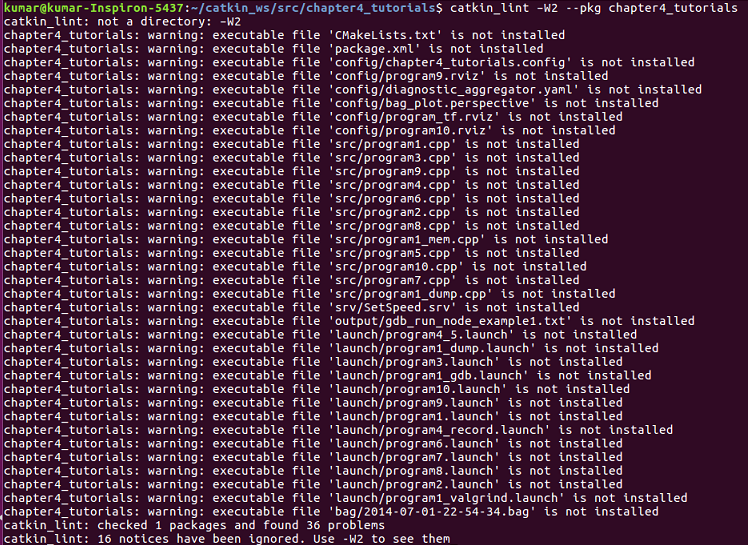
One useful tool is catkin_lint, which diagnoses the potential errors with catkin, generally, in the CMakeLists.txt and package.xml files:
$ catkin_lint -W2 --pkg
In the following screenshot, we can see many warnings for CMakeLists.txt in the chapter4_tutorials package; it is our responsibility to verify whether they are important to consider or not: