
Assessing the Impact of Variables Using Data Tables
A data table is a tool you can use to calculate how one or two variables change the result of a calculation. Use a data table when you want to see the range of results in a worksheet rather than seeing a single result at a time.
Creating a Data Table with One Variable
When you need to see how only one variable changes the result of a calculation, you can quickly create a data table. You place the input values—the values you want to test—in either a row or a column, and then tell Excel where to find them.
Creating a data table seems odd at first, but you'll quickly get the hang of it. Try this example of putting together a data table that uses one variable.
First, create a new worksheet and set up the straightforward =FV() formula shown in Figure 11–1 to calculate the future value of an investment that pays 10% interest over 12 months, has a period of 60 months, and takes $600 out of your pay packet every month. Follow these steps:
- Enter these data labels in the following cells:
- A1. Interest Rate
- A2. Months
- A3. Payment
- A4. Future Value
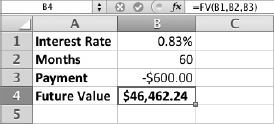
Figure 11–1. The example calculation for the data table uses the FV() function to calculate the future value of a $600-a-month investment.
- Enter the formula =10%/12 in cell B1. Apply the Percentage number format to this cell and make the cell show two decimal places so that you see 0.83% rather than the 1% that Excel typically displays (which makes the calculation visually confusing).
- Enter the value 60 in cell B2.
- Enter the value -600 in cell B3. Apply the Currency number format to make its meaning visually clear.
- Enter the FV function in cell B4: =FV(B1,B2,B3).
So far, so good. Now set up the input values for the data table. Follow these steps:
- Enter the label Months in cell A6.
- Enter the values for the data table in cells A7:A10:
- A7. 48
- A8. 60
- A9. 72
- A10. 84
TIP: It's easy enough to type in the input values for this small data table, but if you want to extend the sequence, try entering 48 in cell A7 and 60 in cell A8, selecting the cells, and then dragging the AutoFill handle to fill in the remaining cells.
Your worksheet should now look like the one in Figure 11–2.
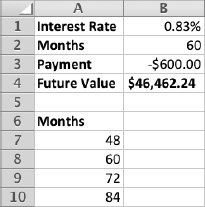
Figure 11–2. Enter the input values for the data table in cells A7:A10.
Now you can enter the formula that uses the data table. For the data table to work, you need to place the formula in the cell where Excel expects to find it:
- Column-oriented data table. Enter the formula in the row above the first input value, and in the next column to the right. In the example, this is cell B6.
- Row-oriented data table. Enter the formula inthe column to the left of the first input value and in the next row down.
In this case, we're creating a column-oriented data table, so we need to enter the formula in cell B6. Enter the formula =FV(B1,A5,B3), as shown in Figure 11–3—in other words, the same formula as in cell B4, but using cell A5 instead of cell B2 to supply the number of months.
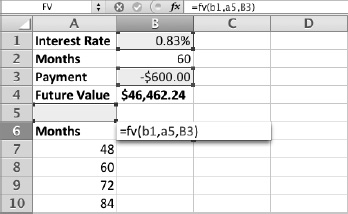
Figure 11–3. Enter the formula in the cell above and to the right of the input values.
NOTE: When you enter the formula for the data table, Excel usually displays either a value that's clearly wrong or an error value. In this example, the formula cell displays the result $0.00, because cell A5 is blank and so is supplying a zero value for the Months argument. In other formulas, a zero value produces an error value. This isn't a problem, as you'll see in a moment.
Now you're ready to set up the data table. Follow these steps:
- Select the range of cells that contains the input values and the formula. In this example, select the range A6:B10.
- Choose Data
 Analysis What-If Data Table from the Ribbon or Data Data Table from the menu bar to display the Data Table dialog box (see Figure 11–4).
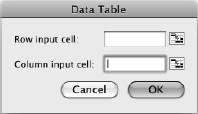
Figure 11–4. In the Data Table dialog box, enter the row input cell or the column input cell for the data table you're creating.
- Click in the Column Input Cell box, and then click the cell you used as the input value—in this case, cell A5. Excel enters an absolute reference, $A$5.
NOTE: When you're creating a row-oriented data table, click in the Row Input Cell box in the Data Table dialog box, and then click the cell you used for the input value.
- Click the OK button to close the Data Table dialog box. Excel enters the array formula {=TABLE(,A5)} in each cell alongside a cell containing an input value.
- Apply the Currency number format to the results cells so that the results appear as dollar values.
Figure 11–5 shows the data table with the results in place.
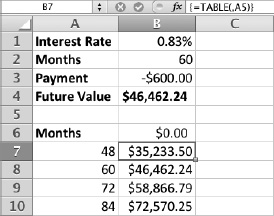
Figure 11–5. After you create the data table, the results appear alongside the input values.
Creating a Data Table with Two Variables
When you need to analyze what happens when two pieces of information used in a calculation change, create a data table with two variables. For example, when calculating an investment with the FV() function, you may need to look at not only different numbers of months for the period but also different payments.
To create a two-variable data table, you place one set of input data down a column to the left of the table and the other set of input data across a row above the table. For example, Figure 11–6 shows a two-variable data table that uses the FV() function to calculate the future value of an investment:
- The range D6:D11 contains the input values for the Period argument (48, 60, 72, 84, 96, or 108 months).
- The range E5:I5 contains the input values for the Payment argument (-$500.00, $550.00, –$600.00, -$650.00, or -$700.00). These cells are formatted with the Currency number format.
- Cell A7 is the row input cell, and cell A9 is the column input cell. When you create the data table by choosing Data Analysis What-If Data Table from the Ribbon or Data Data Table from the menu bar, you specify both the row input cell and the column input cell in the Data Table dialog box.
- Cell D5 contains the formula for the data table: =FV(B1,A9,A7).
- Each results cell contains the formula {=TABLE(A7,A9)}.
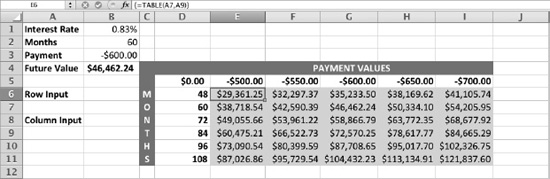
Figure 11–6. In a two-variable data table, you enter one set of input values down a column (here, column D) and the other set of input values in a row (here, row 5). The formula goes in the cell where the column and row intersect (here, cell D5).
NOTE: When you no longer need a data table, select the table, and then press Delete or choose Home ![]() Edit
Edit ![]() Clear
Clear ![]() Clear All.
Clear All.