Using Google Chrome, you open a website of your choice, wait for it to load, and you press F12 to get into the Chrome Developer Tools. A window on the right-hand side will appear, squishing your screen a bit:

In there, the first thing you usually see is the Sources panel open, which gives you an overview of all loaded files in your current view. It provides you with the folder structure loaded from the server and the underlying files as shown in the following screenshot:

The next most relevant tab is Elements, which give you a full overview of the fully rendered HTML code of the current page for inspection. More about this tab is written later in the Inspecting the DOM section.
The Console tab is where the JavaScript magic happens. It allows you to run JavaScript code to, for example, manipulate the DOM, update the styling, or test various code snippets. Furthermore, errors, console.log() output, and warnings will be output in the console log for your information, which is very helpful for identifying and spotting basic issues and bugs with the code:

In this example, the first line, a jQuery selector, was invalid due to a syntax issue and the console.log() provided information about the error. The next line selected those DOM elements in the correct way, and the third line selected the same DOM elements and updated their background-color to be red. Changes and updates executed in the console are only temporary: on website refresh, everything will be reset.
The useful thing about the console log, as already mentioned, is the error logging. When the code of the website, or parts of it, won't run, errors are thrown in there, as can be seen in the next example. It not only highlights the underlying JavaScript file where the code is failing but also provides you with the exact line of code. When clicking on it, Chrome's Developer Tools automatically jumps you to the faulty file and line as the following screenshot shows:

The Memory panel helps you conduct memory profiling of your website if you ever ran into memory issues. Especially for data visualization, where memory-consuming data is graphically visualized, memory performance can play an important role, because it solely relies on the end user's browser memory, not the one of the server.
A very similar one is the Performance panel, which checks the time required to load a web page, memory consumption, and many more performance aspects, thoroughly scanning every single file and interaction that is being made on the web page. The results are displayed graphically as shown in the following example:

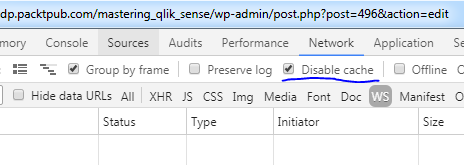
The Network panel allows you to analyze performance, including traffic which goes in and out of your web application, such as the time to download an external file, WebSockets or classic network latency. The Application panel permits you to inspect all resources that are loaded on the web page, including IndexedDB or Web SQL databases, local and session storage, cookies, Application Cache, images, fonts, and style sheets. Lastly, the Security panel will help you troubleshoot security-specific problems such as issues with certificates and more.
While lots of features are available in Chrome DevTools, not all of them will be used regularly or at all in the context of developing mashups or extensions for Qlik Sense. Nevertheless, it's recommended to also visit the official website of Chrome DevTools to familiarize yourself with the different settings and possibilities: https://developers.google.com/web/tools/chrome-devtools/.