
We are going to create an interactive chart with Open Office Drawing. We can insert a chart in a very simple way. We also add images to the chart and hyperlinks to the images. We can also design the same type of activity saving the image as .PNG and use http://www.image-maps.com/.
We are going to work with statistics of the nationality of our students in the school. We first enter the continents' nationalities. If you happen to live in a cosmopolitan city, it would be very interesting! We then add hyperlinks to websites displaying information about the continents.
Enter Open Office Drawing and follow these steps to carry out the activity:
- Click on Insert | Chart.
- Right-click on the chart and choose Chart Data Table.
- Complete the table with the information to display on the chart, using the nationality of the students in the classroom or the school.
- Right-click again on the chart and choose Chart Type.
- Choose Pie | Exploded Donut Chart.
- Tick 3D Look.
- Click on OK.
- Click on Insert |Picture |From file.
- Insert one image related to each continent for each piece of the chart.
- Click on the image | Hyperlink. Complete the block with the hyperlinks. The file will look as shown in the following screenshot:
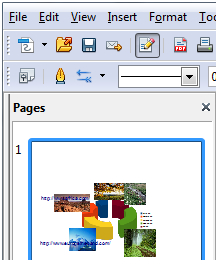
We have just designed a chart with hyperlinks with Open Office. We can insert it in our Moodle course as a resource. So, we can design an activity in several parts. You can make a survey to know the nationality of students if you do not happen to have this kind of information (as we have done in previous recipes). Then, create the chart in Drawing within Open Office (that is your homework!), and add the file as a resource in the Moodle course. Finally, create an Online text activity within Assignments, asking students which continent they find appealing to visit and why based on the