
Inverting and Shifting Parabolas
In addition to inverting parabolas, you can shift them along the x axis. To shift a parabola, you set up an equation that involves using the square of the difference of two values. The equation with which you shift a parabola assumes the following form:
y = (x – b)2
In this form of the equation, the value of b designates the distance along the x axis you want to shift the vertex of the parabola. If b is a positive number, then you shift the parabola to the right on the x axis. If b is a negative number, then you shift the parabola to the left. Here is how you can rewrite the equation when b consists of a negative value.
y = (x – (–b))2
y = (x + b)2
This equation shifts the parabola to the left on the x axis. Following the path explored in the previous section, in addition to altering its position on the x axis, you can invert the parabola. To invert the parabola, you multiply the square of the difference or sum that characterizes the position of the parabola on the x axis by negative 1. Here is how you can write this equation so that you both invert the parabola and shift it to the left:
y = –1(x + b)2
Multiplication by –1 flips the parabola. The vertex opens downward. The addition of the value associated with b shifts it to the left. In the sections that follow, you use Visual Formula to explore these and a few other activities.
To the Right
An equation that features the square of the differences of two values allows you to shift a parabola. As mentioned previously, if the value of b is positive, the expression (x – b)2 shifts the vertex of the parabola to the right. The top equation composition area in Figure 10.35 illustrates the implementation of an equation of this type. The result is the parabola in the Cartesian plane with its vertex facing upward. On the other hand, the bottom equation composition area illustrates the implementation of an inverted parabola, which appears below the x axis in the Cartesian plane. Here are the procedures in Visual Formula for implementing these equations (refer to Figure 10.35):
Then click the menu item for Value. To position the field the Value menu item generates, click just after the opening parenthesis. Type x in the field.
Next, click the Subtract menu item. Click after the field inside the parentheses to position it.
Click the Value menu item again. Click inside the parentheses after the minus sign to position the field the Value menu generates. Type 4 in this field.
To create an exponent, click the Power menu item. To position the Exponent field the Power menu item provides, click to the upper right of the closing parentheses. In the Exponent field, type 2.
In the lower-right panel, set the X Range From field to –8 and the To field to 13.
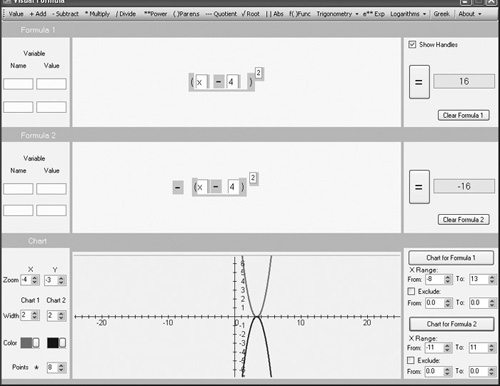
In Figure 10.35, the Cartesian plane shows the graphs of two equations. One opens upward; the other opens downward. The equation that opens downward reads y = –(x – 4)2. It is the same as the previous equation, except the value that orients whether the parabola opens up or down is –1. To implement this equation, use these steps:
Click the menu item for Subtract. To position the minus sign, click in the lower equation composition area.
Click the Parens menu item. To position the parentheses, click to the right of the minus sign. Pull the parentheses apart to allow for two fields and a minus sign.
Click the Value menu item. Inside the parentheses in the lower equation composition area, click to position the Value field. Type x in this field.
Now click the menu item for Subtract. To position the minus sign, click to the right of the Value field.
Then click the Value menu item again, and place the corresponding field to the right of the minus sign. Type 4 in the field.
Click the Power menu item. To position the Exponent field, click to the upper right of the closing parenthesis. After you position the Exponent field, type 2 in it.
Set the Zoom x axis value to –4 and the y axis value to –3.
To generate the graph, in the lower-right panel of Visual Formula, click the Chart for Formula 2 button.
To the Left
As Figure 10.36 shows, the square of the sum of two values generates parabolas that are shifted to the left of the y axis. Multiplying the sums by negative numbers inverts the parabolas. The equations you employ to shift and generate parabolas of this type work in the same fashion as the equations discussed in the previous section. The difference is only that the parabolas are shifted to the left.
Figure 10.36. You shift the parabola to the right by squaring the sum of two numbers.

When you shift the parabolas to the left, you in essence subtract a negative value. You can write the equation as y = (x –(–b))2, but it is just as easy to write it in the form you see depicted in Figure 10.36. When you multiply the sum by –1, you invert the parabola.
To implement these two parabolas as shown in Figure 10.36, follow the steps in the previous section. At Step 3 in the upper equation and at Step 4 in the lower equation, instead of using a minus sign between the two fields within the parentheses, click the Add menu item and position the plus sign after the first Value field.
Absolute Values
In Figure 10.37, equations that feature the differences and sums of absolute values generate shifts to the right and the left of the y axis. You shift the V that is on the right of the y axis by subtracting 4 from the variable x. The equation that accomplishes this is y = |x – b|.
Figure 10.37. You shift an absolute value to the right by subtracting a constant from the variable.
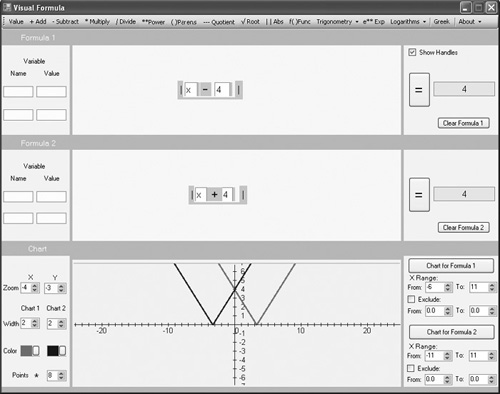
The equation that features the sum of two values generates the shift to the left. The V on the left of the y axis has been shifted by adding 4 to the value of the variable. The equation that accomplishes this is y = |x + b|.
To implement the top equation, refer to Figure 10.37 and use the following steps:
Click the Abs menu item. To position the bars for the absolute value, click in the upper equation composition area. Pull the bars far enough apart to accommodate two fields and a minus sign.
To create the minus sign, click on the Subtract menu item. To position the minus sign, click inside the absolute value bars after the x Value field.
To create the field for the (?) shift constant (b), click the Value menu item. Then click within the absolute value bars after the minus sign. Type a 4 in this field.
To generate the graph of the absolute value equation, in the lower-right panel click the Chart for Formula 1 button. The V you see on the right of the y axis in Figure 10.37 appears.
A V also appears on the left side of the y axis in Figure 10.37. To generate this figure, work within the lower of the two equation composition areas and use the following steps:
Click the Abs menu item. To position the bars for the absolute value, click in the lower equation composition area. Pull the bars far enough apart to accommodate two fields and a plus sign.
Click the Value menu item. Click inside the absolute bars to position the Value field. Type x in this field.
To create the plus sign, click on the Add menu item. To position the plus sign, click inside the absolute value bars after the x Value field.
To create the field for the (?) shift constant (b), click the Value menu item. Then click within the absolute value bars after the plus sign. Type a 4 in this field.
To generate the graph of the absolute value equation, in the lower-right panel click the Chart for Formula 2 button. The V you see on the left of the y axis in Figure 10.37 appears.