Nonlinear Absolute Values
Equations can contain terms that possess exponents and that are also absolute values. The graph of such an equation in some ways resembles the graph of a linear equation that possesses an absolute value because the values you plot for the y axis are all positive, while those you plot for the x axis are both negative and positive. Here is an example of an equation that requires you to plot the absolute value of the cube of x:
y = |x3|
As the graph on the right in Figure 10.13 illustrates, when you do not designate the absolute value of a cube, an equation with a cube can generate negative numbers. This is so because an expression such as –x · –x · –x renders a negative product. The graph of an equation involving a cube for this reason can extend into quadrant III. However, if you perform this operation in the context provided by an absolute value, then the product is positive. The expression |–x · –x · –x| renders positive y values.

To employ Visual Formula to implement an equation that generates values using the absolute value of a cube, use the following steps (refer to Figure 10.14):
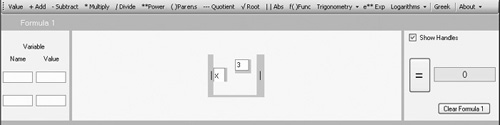
Click the menu item for absolute values (Abs). Then click in the equation composition area to position the absolute value bars. Verify if the Show Handles check box on the right of the composition area is checked. If it is not checked, then click it.
Use the mouse cursor to resize the area between the absolute value bars. To accomplish this, position the cursor on the right absolute value bar and when the cursor turns into a line with arrows on either end, drag the absolute value bar to the right. To make the area longer, position the cursor on the bottom of the area between the absolute value bars and when the cursor turns into a line with arrows on either end, drag the area down.
Click on the Value menu item. Then place a Value field in the absolute value area. Type an x in the value field.
Click on the Power menu. Then place a field for the exponent to the upper right of the Value field. Type a 3 in the Exponent field.
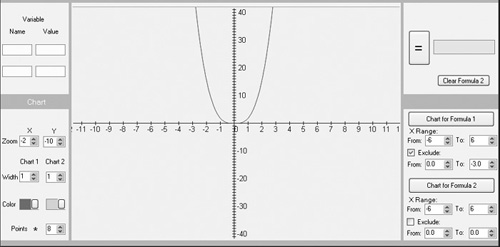
In the lower-right panel, click the Chart for Formula 1 button. The graph of the absolute value function appears in the Cartesian plane (see Figure 10.15).
Figure 10.14. Position the absolute value bars before you position the Value field.
To adjust the lengths of the lines you see graphed, click the X Range number controls.