
Working with Polynomials
Given a review of how to identify a polynomial, it is also appropriate to review a few of the characteristic activities you perform in association with polynomials. First, when you replace the variable in a polynomial with a number, you find the value of the polynomial. Along the same lines, when you employ operations to determine the value of the variable in a polynomial, then you evaluate the polynomial.
When you state a polynomial so that you represent the variable of the polynomial on one side of an equal sign, and then place another variable on the other side to represent the value of the polynomial, then you create a polynomial equation. Many of the equations you have dealt with in preceding chapters have been, in this respect, polynomial equations.
As you have seen repeatedly, to evaluate such an equation, a standard approach involves supplying a value to the variable of the expression, and then solving the equation for the value of the variable. The value of the equation corresponds to the value of the variable, so in this way, you create an ordered pair. When you have generated two or more ordered pairs in this way, you can plot them in the Cartesian plane to create a graph of the equation.
In previous chapters, you have extensively explored graphs of linear equations. In a few instances, you explored graphs that did not involve linear equations. As mentioned previously, a linear equation generates a line that possesses a slope that does not change. In contrast, a non-linear equation generates a line that possesses a slope that does change.
To review the notion of a changing slope, consider Figure 8.1. To generate the values for the graph shown in the figure, you use this equation:
0.06a2 + 3a + 1.5
Figure 8.1. A polynomial establishes a hypothetical trend for the effect of a mosquito repellent.
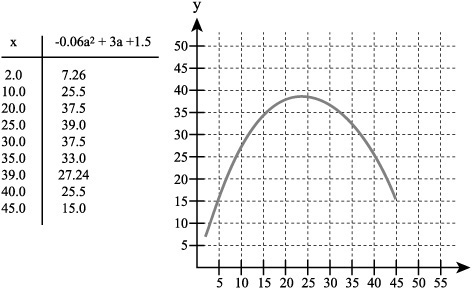
As the figure illustrates, the curve that results from calculating representative values of x creates something akin to an arc tracing the path of an arrow. Along its ascending path, the slope is consistent and resembles that of the graph of a linear equation. Then the path changes and with it the slope. The slope evens out and then turns downward.
The graph of this polynomial might represent the effectiveness of a given brand of mosquito repellent in relation to the number of hours that elapse after you apply it. Accordingly, for the first few hours, the number of mosquitoes that alight and immediately retreat without biting increases consistently. After around 25 hours, however, this trend changes. At a declining rate, the mosquitoes fail to retreat, and the trend shows that after roughly 50 hours, the effects of the repellent completely disappear.
A polynomial function allows you to trace such changing trends because its slope does not remain consistent throughout its extent. In the instance of the mosquito repellent, the slope changes from one moving in a positive direction to one moving in a negative direction. It shows a trend characterized by a moment of maximum effectiveness preceded and followed by periods of increasing and declining effectiveness.