
Slopes That Do Change
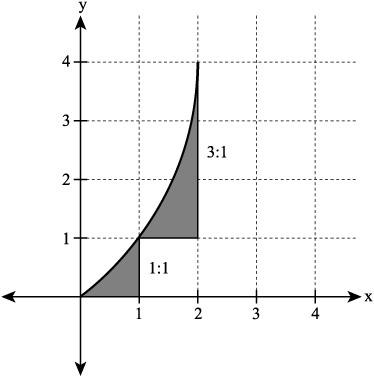
As a momentary contrast with linear functions, consider at this point the graph of a function that generates a line with a slope that does change. Figure 6.8 illustrates a curve that you can generate using a quadratic equation. The lower part of the curve reveals a slope of approximately 1. For every one unit on the y axis, the lower part of the curve moves one unit on the x axis. However, after the line climbs past 1 on the y axis, the slope changes. For one unit on the x axis, the line climbs 3 units on the y axis. The slope for this part of the curve is approximately 3. In this respect, then, the line does not reveal the work of a linear function.
Figure 6.8. The line of a non-linear function reveals a slope that changes, depending on the segment of the line you investigate.
Note
A linear function generates a line that possesses a slope that remains constant throughout. A non-linear function does not.