A Venn diagram allows you to easily show subsets, intersections, unions, and disjunctions. To create a Venn diagram, you employ rounded figures that you overlap and shade to show relationships between them. Figure 3.1 illustrates Venn diagrams that represent different types of relationships between sets. Table 3.1 provides a discussion of each of the diagrams.
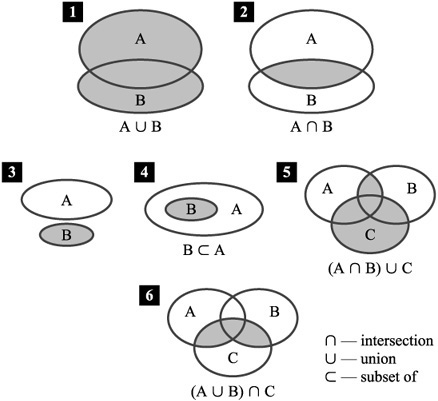
Figure 3.1. Venn diagrams allow you to visualize relationships between sets.
Table 3.1. Venn Diagram Descriptions
Item
Discussion
Diagram 1
Set A forms a union with set B. In this relationship, the two sets share common elements, but at the same time, the resulting set consists of all elements that the two sets contain.
Diagram 2
Set A forms an intersection with set B. The two sets contain common elements, and the common elements constitute the intersection of the two sets.
Diagram 3
The disjunction of the two sets, A and B, creates a situation in which you must form an “or” statement to account for the elements of the two sets.
Diagram 4
Set B is a subset of set A. In this case, each element of set B is also an element of set A.
Diagram 5
This is a compound relationship. First, you create an intersection between sets A and B. Given this intersection, you then find the union of the intersected elements and set C.
Diagram 6
This is a compound relationship. First, you find a union of sets A and B. Such a union takes the form of Diagram 1. However, the second part of the statement defining Diagram 6 calls for set C to form an intersection with the union of A and B. The intersection then excludes elements that are not common to A, B, and C.